
TIC #5 Geometry and Statistics Interactive Demo
Loading the math board and drawing, please wait…
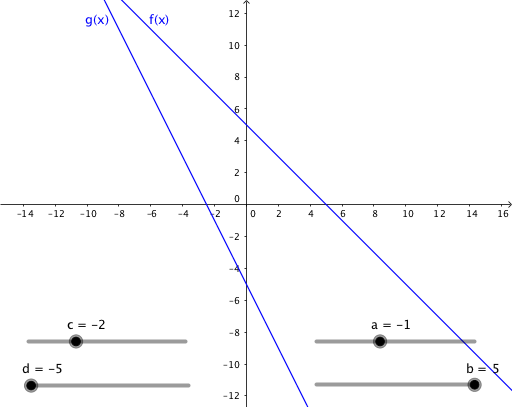
This example demonstrates the intersection of a cuboid with straight lines and curves, combined with statistical charts to show data variations interactively. It involves core mathematical concepts like coordinate geometry, sequences, function graphing, solid geometry, and statistics. GeoGebra commands such as Sequence, Append, and TableText are used, along with objects like Xs and A1 for dynamic data management. Suitable for high school and above students to understand the integration of spatial geometry, function plotting, and data analysis.
GeoGebra Commands & Parameters
Sequence(-10, 10) → XsAppend("x", Xs) → XsTAppend("f(x)", Lf) → LfTAppend("g(x)", Lg) → LgTTableText({XsT, LfT, LgT}, "v|_") → text1