
Correlation Study
Loading the math board and drawing, please wait…
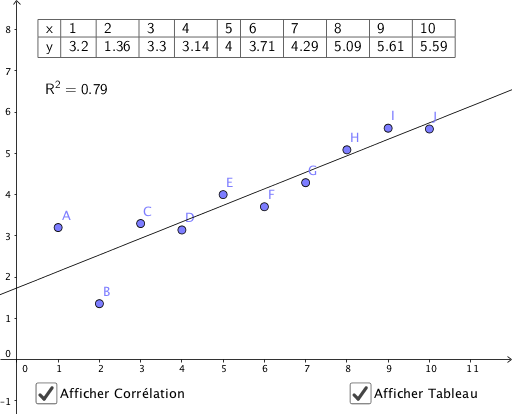
This example demonstrates how to use GeoGebra to plot data points and fit a linear regression line, visually illustrating the calculation and significance of the correlation coefficient. Core mathematical concepts include correlation coefficient, linear regression, least squares method, and rational number operations. Key GeoGebra commands and objects used, as derived from the construction summary, are Sequence, Line, Point, FitLineY, RSquare, and TableText. Suitable for high school and above students to understand data analysis methods in statistics and calculus.
GeoGebra Commands & Parameters
Sequence((i, 0), i, 1, 10) → list1Line(list1(1), list1(2)) → fSequence(OrthogonalLine[list1(i), f], i, 1, Length[list1]) → list2Point(list2(10)) → JPoint(list2(9)) → IPoint(list2(8)) → HPoint(list2(7)) → GPoint(list2(6)) → FPoint(list2(5)) → EPoint(list2(4)) → DPoint(list2(3)) → CPoint(list2(2)) → BPoint(list2(1)) → AFitLineY({A, B, C, D, E, F, G, H, I, J}) → gFitLineY(list1) → hRSquare({A, B, C, D, E, F, G, H, I, J}, g) → R_gLine(v, w) → iRSquare({A, B, C, D, E, F, G, H, I, J}, i) → R_iTableText({{x, 1, 2, 3, 4, 5, 6, 7, 8, 9, 10}, {y, y(A), y(B), y(C), y(D), y(E), y(F), y(G), y(H), y(I), y(J)}}, "|_") → text3