
The Rate of Change of the Sine Function: Exploring Tangent Slopes with GeoGebra
Loading the math board and drawing, please wait…
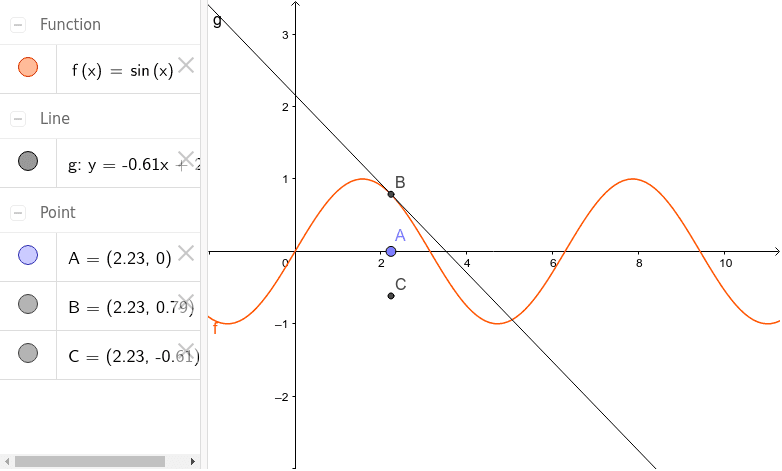
This GeoGebra example dynamically illustrates the slope of a tangent line to the sine curve at a movable point, revealing the geometric meaning of the derivative as an instantaneous rate of change. Core mathematical concepts include the sine function, derivatives, tangent line slope, and local variation of functions. Construction highlights: using the Point command to create a movable point A on the sine function f, and the Tangent command to generate the tangent line g at that point, with an additional point C possibly marking the tangent point or slope indicator. By dragging point A, students observe how the tangent slope changes along the curve, linking the sine function's derivative to the cosine function. This resource is ideal for high school precalculus or introductory calculus students to build an intuitive understanding of derivatives and to explore the relationship between a function and its derivative graph.
GeoGebra Commands & Parameters
Point(xAxis) → ATangent(B, f) → g