
Table of Values: Parabola, Incircle, Power Functions, Normal Distribution, and C
Loading the math board and drawing, please wait…
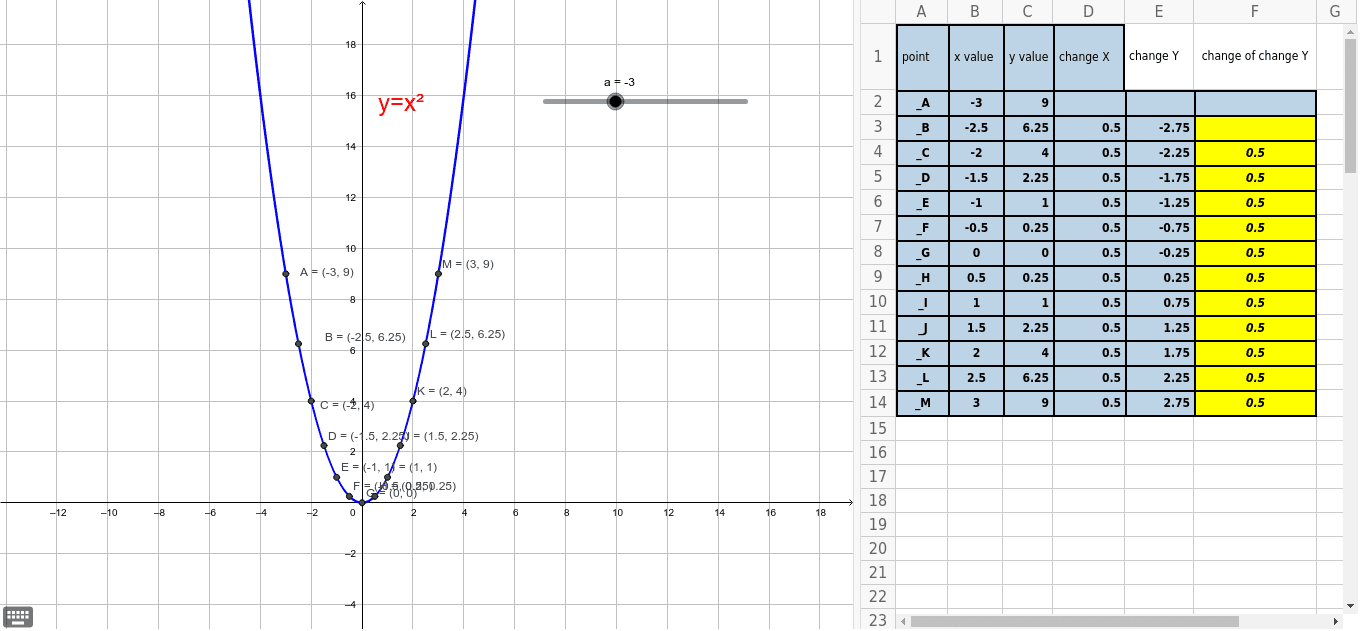
① This example demonstrates a dynamic table of values that integrates multiple mathematical phenomena, including a parabola, an incircle, power functions, a normal distribution, diagrams, and correlation. ② Core mathematical concepts include quadratic functions, properties of an incircle in a triangle, power function behavior, normal distribution curves, data visualization, and correlation analysis, all linked through a live numerical table. ③ Construction highlights: Based on the construction summary, objects such as c (likely a circle or curve), a (possibly a parameter or line), and points A, B, C, D, E, G, F are used, along with series of points A1–A13 and B1–B11, and a text object text1. The table is generated via GeoGebra's spreadsheet view and dynamic calculations, enabling synchronized updates across all objects. ④ Suitable for high school and above, this example is ideal for integrated math exploration, combining functions and geometry, and for teaching data visualization or creating interactive numerical tables.
GeoGebra Commands & Parameters
Conic cNumeric a(-3.0)(a, a^(2))(a + 0.5, (a + 0.5)^(2))(a + 1, (a + 1)^(2))(a + 1.5, (a + 1.5)^(2))(a + 2, (a + 2)^(2))(a + 3, (a + 3)^(2))(a + 2.5, (a + 2.5)^(2))x(A)x(B)x(C)x(D)x(E)x(F)x(G)(a + 3.5, (a + 3.5)^(2))(a + 4, (a + 4)^(2))x(H)x(I)(a + 4.5, (a + 4.5)^(2))x(J)(a + 5, (a + 5)^(2))(a + 5.5, (a + 5.5)^(2))x(K)x(L)(a + 6, (a + 6)^(2))x(M)y(A)y(B)y(C)y(D)y(E)y(F)y(G)y(H)y(I)y(J)y(K)y(L)y(M)B4 - B3B5 - B4B3 - B2B6 - B5C3 - C2C4 - C3C5 - C4C6 - C5E4 - E3E5 - E4E6 - E5B7 - B6B8 - B7B9 - B8B10 - B9B11 - B10B12 - B11B12 - B11B14 - B13
AI Drawing Prompt Reference
Draw the parabola y = x² with a movable parameter a initially set to -3. Plot points on the curve at x = a, a+0.5, a+1, a+1.5, a+2, a+2.5, a+3, a+3.5, a+4, a+4.5, a+5, a+5.5, a+6. Create a table showing the x‑ and y‑coordinates of these points and compute the first differences of successive x‑values and y‑values.
The prompt above was compiled from the original drawing commands and is for reference only.