
Systems of Inequalities Graphing
Loading the math board and drawing, please wait…
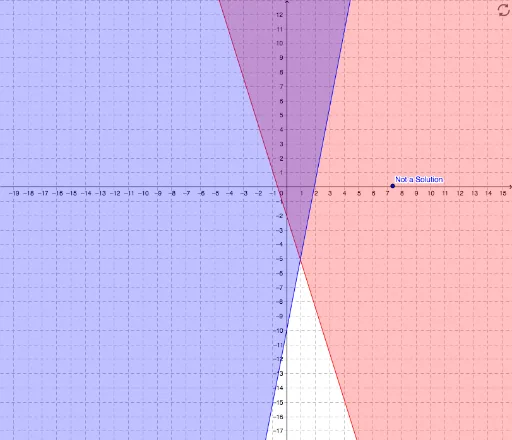
This example demonstrates how students can graph and observe the solutions for systems of inequalities. It involves core math concepts like inequalities, region representation, and linear function graphs. Constructed using GeoGebra commands like DynamicCoordinates and Polygon, it is suitable for high school students to learn and understand the geometric meaning and practical applications of inequality systems.
GeoGebra Commands & Parameters
DynamicCoordinates(A, x(A), y(A)) → BDynamicCoordinates(A, x(A), y(A)) → CDynamicCoordinates(A, x(A), y(A)) → DDynamicCoordinates(A, x(A), y(A)) → EDynamicCoordinates(A, x(A), y(A)) → FDynamicCoordinates(A, x(A), y(A)) → GDynamicCoordinates(A, x(A), y(A)) → HDynamicCoordinates(A, x(A), y(A)) → IDynamicCoordinates(A, x(A), y(A)) → JDynamicCoordinates(A, x(A), y(A)) → KDynamicCoordinates(A, x(A), y(A)) → LDynamicCoordinates(A, x(A), y(A)) → MDynamicCoordinates(A, x(A), y(A)) → NDynamicCoordinates(A, x(A), y(A)) → ODynamicCoordinates(A, x(A), y(A)) → PPolygon(Q, R, 4) → poly1, q, r, s, t, S, TPolygon(Q_1, R_1, 4) → poly1_1, q_1, r_1, s_1, t_1, S_1, T_1
AI Drawing Prompt Reference
Graph multiple points and connect them to form quadrilaterals, demonstrating the solution regions for systems of inequalities, with dynamic coordinate axes to observe the geometric meaning of inequalities, suitable for high school students to learn practical applications and geometric representations of inequality systems.
The prompt above was compiled from the original drawing commands and is for reference only.