
Sydney Harbour Bridge Parabola Comparison
Loading the math board and drawing, please wait…
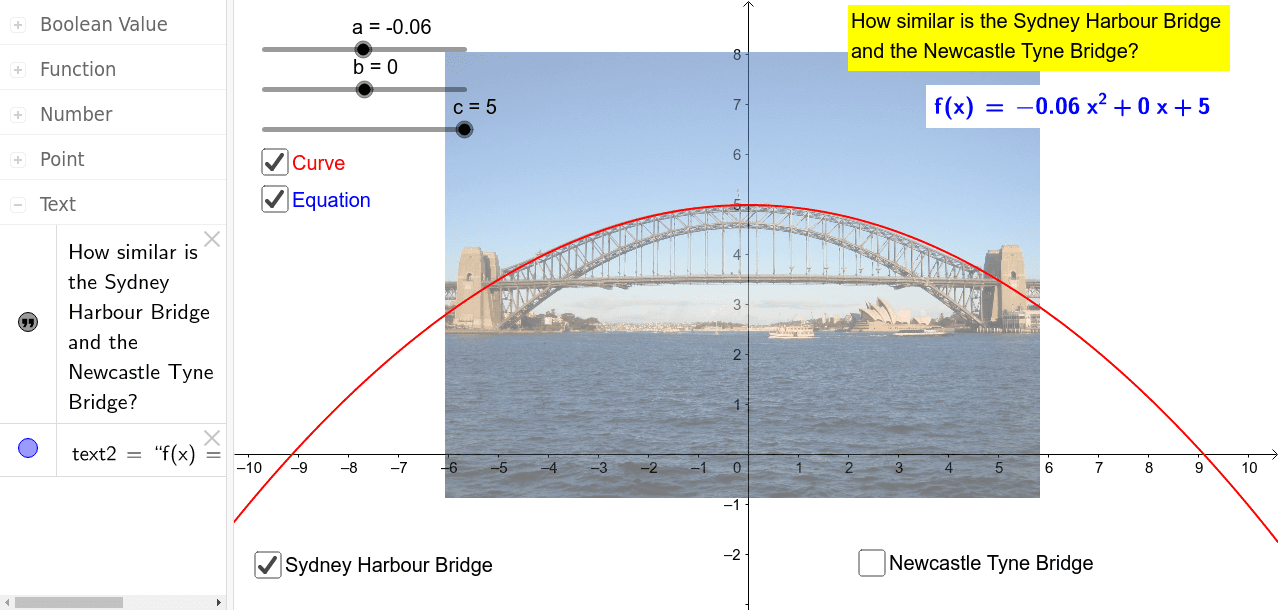
By using checkboxes, you can investigate the differences between the two bridges. This example demonstrates the geometric properties of parabolas, involving the graphing of functions. GeoGebra objects such as text, points, and images are used to observe the changes in the parabola by adjusting parameters. Suitable for high school mathematics education and learning.
GeoGebra Commands & Parameters
LaTeX(f, true, true) → text2