
Sum of Two Dice Rolls
Loading the math board and drawing, please wait…
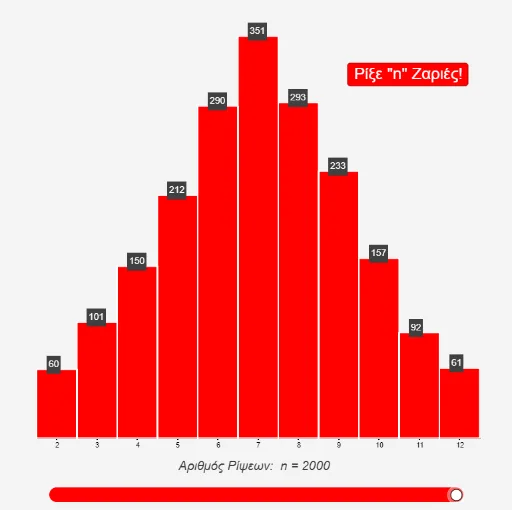
This example demonstrates the possible sums when rolling two dice. The core mathematical concepts involved are random events and probability distribution in probability statistics. The construction highlights the use of the Sequence command to generate random numbers and the Histogram command to plot the distribution of the sums. Suitable for middle school and above students to learn probability statistics.
GeoGebra Commands & Parameters
Sequence(Sum[{Random[1, 6], Random[1, 6]}], w, 1, 2000) → L_1Sequence(w, w, 1.5, 12.5) → L_2Histogram(L_2, Take[L_1, 1, n], true, 0.01) → aPolygon((1.4857024793388431, 99.98654902836721), (1.4857024793388431, -100.01345097163279), (-99.76429752066115, -100.01345097163279), (-99.76429752066115, 99.98654902836721)) → q1, f, g, h, iHistogram(L_2, Take[L_1, 1, n], true, 0.01) → bMirror(q1, (7, 0)) → q1'Take(L_1, 1, n) → L_3Sequence(CountIf[x ≟ w, L_3], w, 2, 12) → L_4Sequence(Text[L_4(w - 1), (w - 0.21, (0.01 * L_4(w - 1)) + 0.02)], w, 2, 13) → L_5