
Straight Line Graphs: Dynamic Slope and Intercept Exploration
Loading the math board and drawing, please wait…
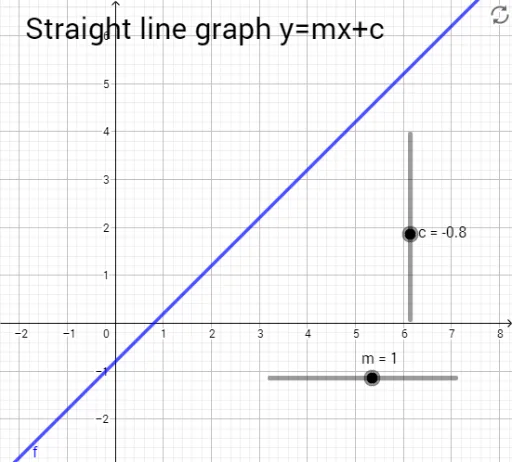
① This GeoGebra example dynamically illustrates the graph of the linear equation y = mx + c, showing how the slope m and the y-intercept c affect the line's steepness and position. ② Core mathematical concepts include linear functions, slope-intercept form, geometric interpretation of slope and intercept, and the relationship between algebraic expressions and their graphs. ③ Construction highlights: sliders m and c control the slope and intercept, function f defines the line, and text1 displays the current equation in real time, allowing users to see immediate changes as parameters are adjusted. ④ Suitable for middle school to high school students learning linear functions and introductory coordinate geometry, as well as for classroom demonstrations or self-directed exploration to build intuitive understanding of how algebraic parameters translate into visual graph transformations.
GeoGebra Commands & Parameters
Numeric m(1)Numeric c(-0.8)y = (m * x) + c