
Statistics: Regression and Correlation
Loading the math board and drawing, please wait…
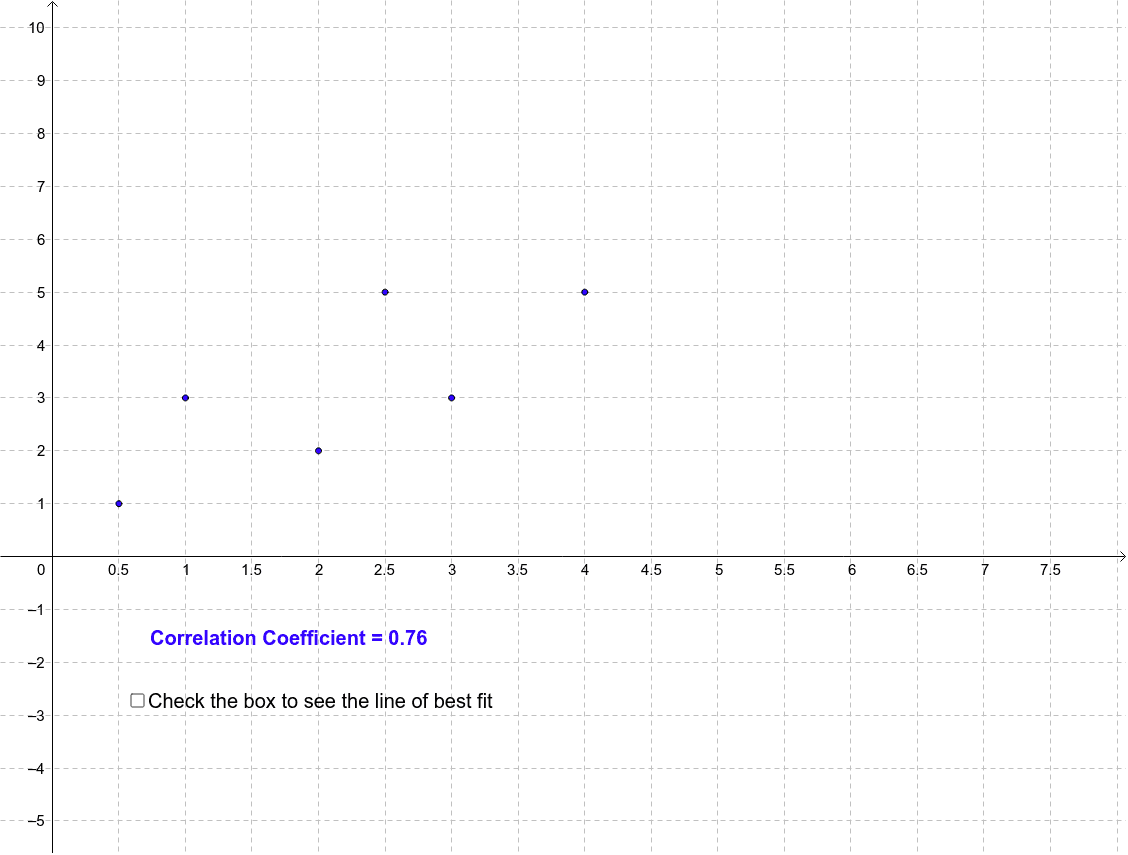
This example demonstrates the calculation of the correlation coefficient through changes in a scatter graph. It involves key statistical concepts such as correlation and linear regression. Using GeoGebra commands PMCC and FitLineY, you can observe how data point changes affect the correlation coefficient. Suitable for high school and above students or teachers for teaching or self-study.
GeoGebra Commands & Parameters
PMCC(list1) → rFitLineY(list1) → a