
Statistical Distributions
Loading the math board and drawing, please wait…
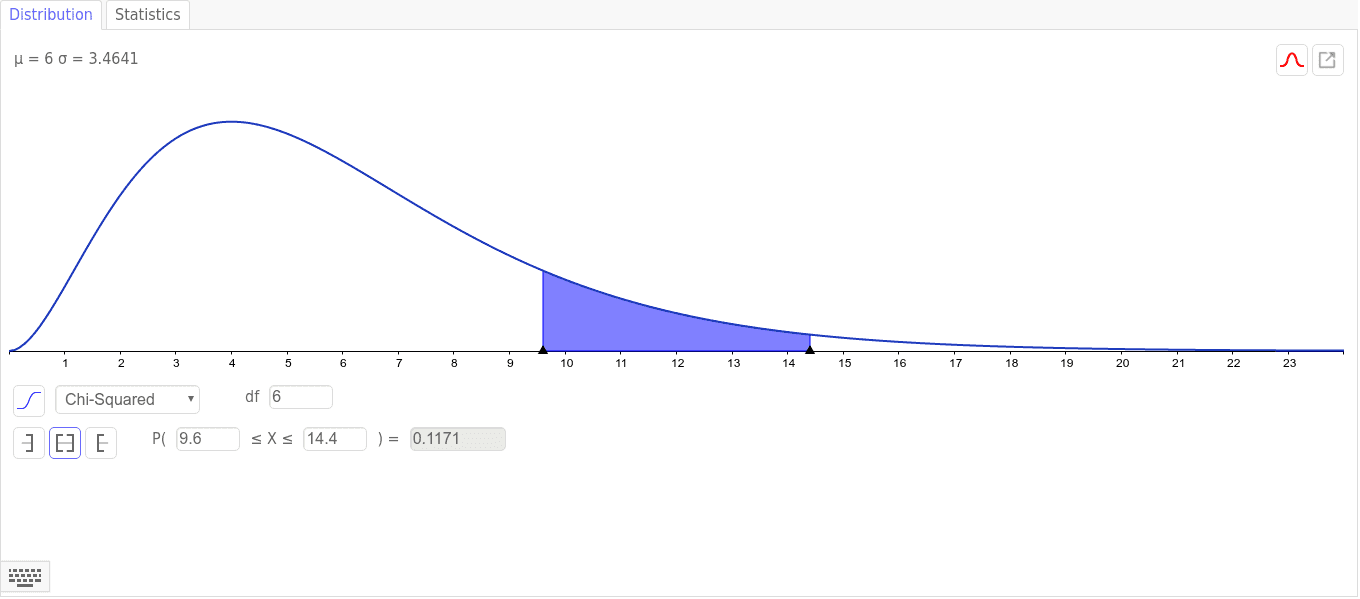
This example demonstrates the graphical representation and properties of various statistical distributions. It involves core math concepts like probability & statistics, function graphing, polynomial functions, linear programming, and optimization. Construction highlights include using GeoGebra to plot distribution functions, animate parameters with sliders, and solve linear programming problems for optimal solutions. Suitable for high school students and beginners in statistics to understand statistical models and optimization problems.