
Standard Deviation of Sample Means Project
Loading the math board and drawing, please wait…
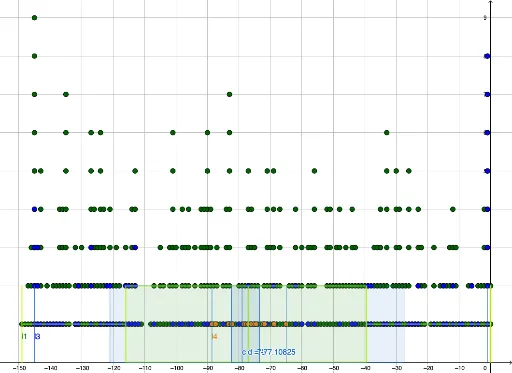
This example demonstrates the calculation and visualization of the standard deviation of sample means. Key math concepts include sample mean, standard deviation, and probability distributions. GeoGebra commands used are DotPlot for histograms, mean for calculating mean, stdevp for population standard deviation, Sample for generating samples, stdev for sample standard deviation, Length for getting length, and BoxPlot for box plots. Suitable for university statistics courses.
GeoGebra Commands & Parameters
DotPlot(U) → l1mean(U) → mustdevp(U) → sigmaUSample(U, 97) → l2DotPlot(l2) → l3mean(l2) → ubarstdev(l2) → sDotPlot(m) → l4Length(m) → amean(m) → mbarstdev(m) → smBoxPlot(1, 1, U) → bBoxPlot(1, 1, l2) → cBoxPlot(1, 1, m) → d
AI Drawing Prompt Reference
Create a statistical visualization comparing three data distributions. Start with a dot plot of the original population, marking its mean and population standard deviation. Then, take a random sample from this population, display it as a second dot plot, and label its sample mean and sample standard deviation. Next, generate many sample means by repeated sampling, show their distribution in a third dot plot, and annotate the mean and standard deviation of these sample means. Finally, place three box plots side by side—one for the original data, one for the single sample, and one for the collection of sample means—to visually compare their spread and central tendency.
The prompt above was compiled from the original drawing commands and is for reference only.