
Standard Deviation Formula – Interactive Secondary School Example
Loading the math board and drawing, please wait…
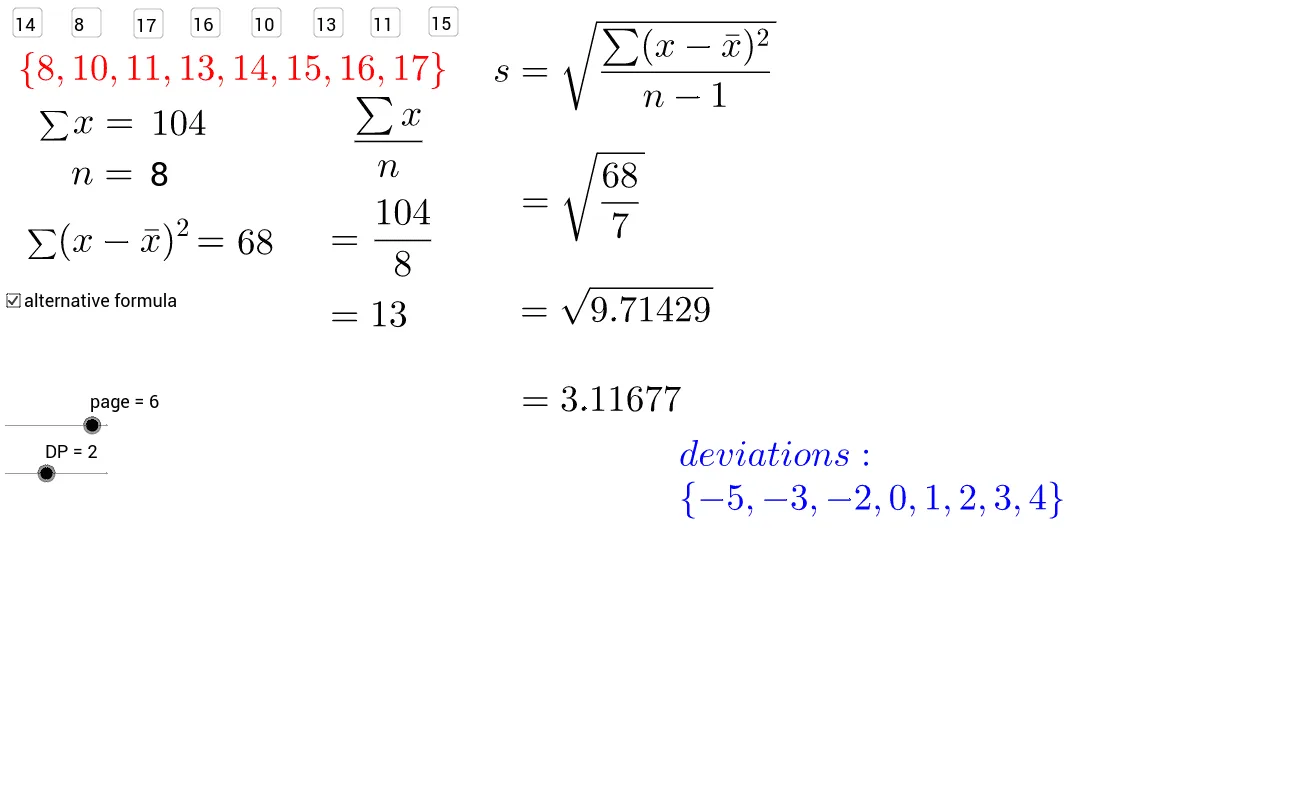
This GeoGebra example illustrates the calculation of standard deviation using the classical formula at a secondary‑school level. Learners input a data set via text fields; the construction automatically computes the mean (Mean), the sum of squared deviations (Sum, Sequence), and finally the standard deviation (SD). Core concepts include arithmetic mean, variance, standard deviation, and their role in describing data spread. The construction employs Sort, Sum, CountIf, Textfield, Mean, and Sequence commands, and defines objects such as n, sum, sumSQ, SDsq, SD, DP to store intermediate results. Ideal for high‑school statistics, algebra, or data‑analysis units, this interactive tool supports visual and step‑by‑step understanding of dispersion measures.
GeoGebra Commands & Parameters
Sort({a, b, c, d, e, f, g, h}) → orderedSum(ordered) → sumCountIf(x ≤ 1000, ordered) → nSum(orderedSQ) → sumSQTextfield(a) → inputBox1Textfield(b) → inputBox2Textfield(c) → inputBox3Textfield(d) → inputBox4Textfield(e) → inputBox5Textfield(f) → inputBox6Mean(ordered) → meanTextfield(g) → inputBox7Textfield(h) → inputBox8Sequence(Element[ordered, i] - mean, i, 1, Length[ordered]) → devSum(dev^(2)) → sumdevSQ
AI Drawing Prompt Reference
This is an interactive graphic that illustrates the standard deviation calculation process. The graphic includes an input data box, a results display area, and key objects: the data sequence, mean, squared deviation sequence, and standard deviation. The construction order is: first input the data and sort it, then calculate the mean, next calculate the squared deviations of each data point from the mean, and finally compute the standard deviation. The graphic visually presents the steps of calculating data distribution and dispersion, suitable for teaching.
The prompt above was compiled from the original drawing commands and is for reference only.