
Standard Deviation Formula Demonstration
Loading the math board and drawing, please wait…
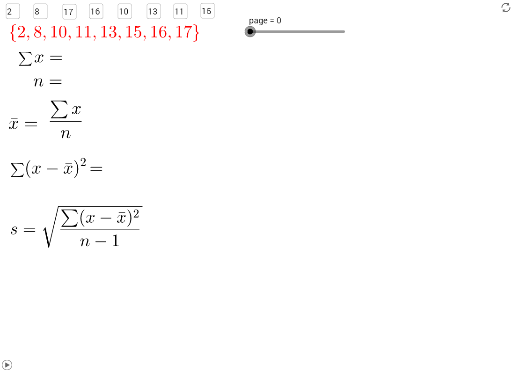
This example demonstrates the calculation of standard deviation using GeoGebra, involving core concepts like standard deviation formulas, mean calculation, and conditional probability. It utilizes commands and objects such as Sort, Sum, CountIf, Textfield, Mean, and Sequence. Suitable for secondary school mathematics education to help students understand the method of standard deviation calculation.
GeoGebra Commands & Parameters
Sort({a, b, c, d, e, f, g, h}) → orderedSum(ordered) → sumCountIf(x ≤ 1000, ordered) → nSum(orderedSQ) → sumSQTextfield(a) → inputBox1Textfield(b) → inputBox2Textfield(c) → inputBox3Textfield(d) → inputBox4Textfield(e) → inputBox5Textfield(f) → inputBox6Mean(ordered) → meanTextfield(g) → inputBox7Textfield(h) → inputBox8Sequence(Element[ordered, i] - mean, i, 1, Length[ordered]) → devSum(dev^(2)) → sumdevSQ
AI Drawing Prompt Reference
Draw the process of calculating variance for a set of data. First, input 8 data points, then sort them, calculate the sum, the count of data less than 1000, and the sum of squares. Next, compute the mean, then calculate the sum of squares of the differences between each data point and the mean, and finally display these calculations.
The prompt above was compiled from the original drawing commands and is for reference only.