
Standard Deviation Exploration
Loading the math board and drawing, please wait…
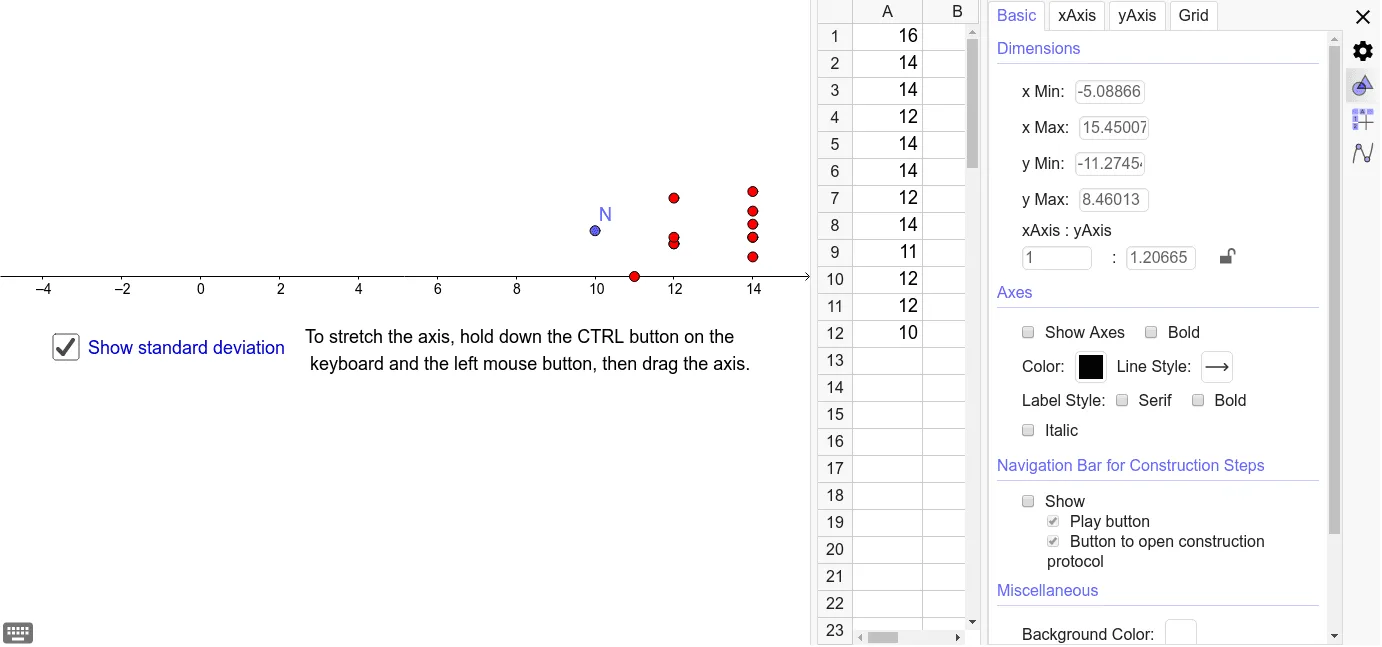
This example demonstrates the concept and calculation of standard deviation. By adjusting the positions of data points, one can observe how the dispersion of data affects the value of standard deviation. Key mathematical concepts include standard deviation, data distribution, and basic statistics. It utilizes GeoGebra objects and commands such as points, lines, and loci. Suitable for high school mathematics and statistics courses.
GeoGebra Commands & Parameters
Point M(16, 1.2)Point L(14, 1.2)Point B(14, 1.2)Point A(16, 1.8)Point C(14, 2.6)Point D(12, 1)Point E(14, 0.6)Point F(14, 2)Point G(12, 2.4)Point H(14, 1.6)Point I(11, 0)Point J(12, 1)Point K(12, 1.2)x(C)x(D)x(E)x(F)x(G)x(H)x(I)x(J)x(K)x(B)Boolean c(true)Numeric d(5)Numeric e(4)Numeric f(4)Numeric g(2)Numeric B2(12)Numeric C2(1.2)Numeric B3(12)Numeric C3(1.2)Numeric B4(12)Numeric C4(1.2)Numeric B5(10)Numeric C5(1.2)Numeric B6(10)Numeric C6(1.2)Numeric B7(10)Numeric C7(1.2)Numeric B8(10)Numeric C8(1.2)Numeric B9(10)Numeric C9(1.2)Numeric B10(10)Numeric C10(1.2)Numeric B11(10)Numeric C11(1.2)Numeric B12(10)Numeric C12(1.2)Numeric B13(10)Numeric C13(1.4)Numeric B14(10)Numeric C14(1.4)Numeric B15(10)Numeric C15(1.4)Numeric B16(10)Numeric C16(1.4)Numeric B17(10)Numeric C17(1.4)
AI Drawing Prompt Reference
Create a statistical diagram for exploring standard deviation. Place a set of data points on a coordinate plane, with x-coordinates roughly between 10 and 16 and y-coordinates between 0 and 2.6. Several points lie near y=1.2, forming a horizontal reference line, while others are scattered above and below to show dispersion. Connect each point to the reference line with a vertical segment to illustrate deviation from the mean. Display the calculated standard deviation value on the side, and allow dragging the points to dynamically update this value, demonstrating how spread affects the result. The layout should be clear and suitable for classroom use.
The prompt above was compiled from the original drawing commands and is for reference only.