
Standard Deviation Demo
Loading the math board and drawing, please wait…
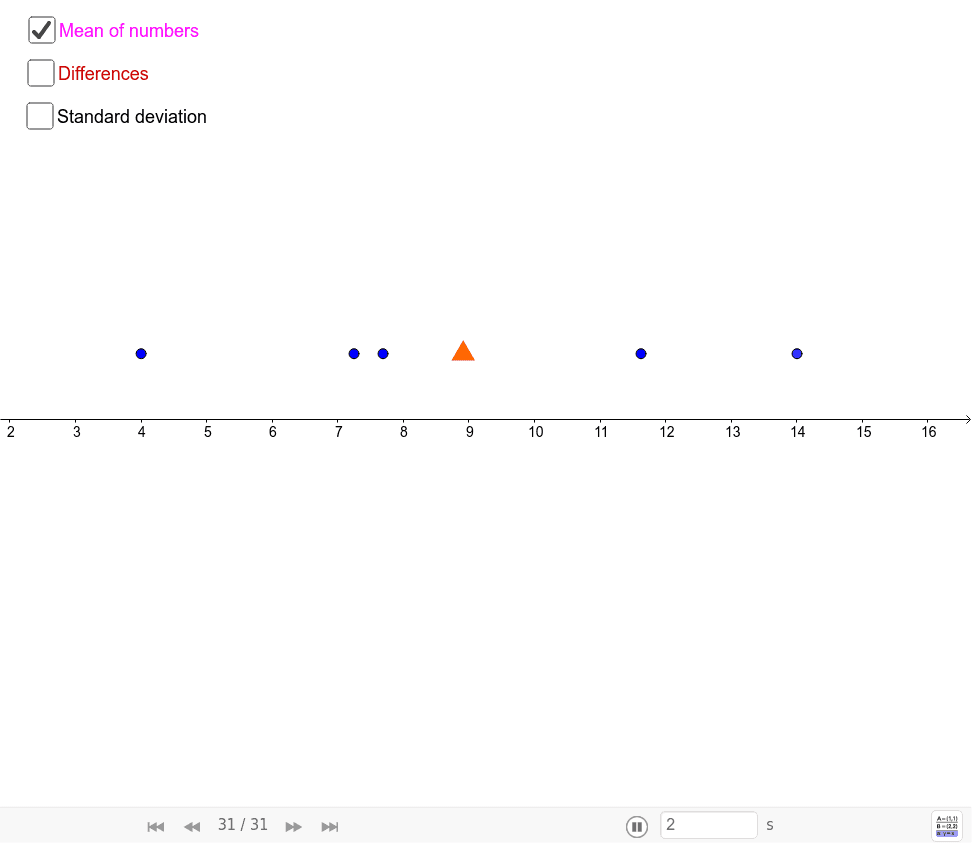
This example dynamically demonstrates the concept of standard deviation, showing the dispersion of data distribution. It involves core math concepts like standard deviation, probability, random experiments, tangent function, intersection, and kite. Construction highlights include using GeoGebra commands like Segment and Variance to create objects such as a, b, c, d, e, A, B, C, D, E, F, f, G, L, H, I, J, K, M, g, h, N, i, O, j, P, k, m, text2, n, o. Suitable for high school mathematics teaching, particularly for introductory probability and statistics.
GeoGebra Commands & Parameters
Segment(L, G) → gSegment(M, H) → hSegment(N, I) → iSegment(O, J) → jSegment(P, K) → kVariance({a, b, c, d, e}) → m
AI Drawing Prompt Reference
Draw a dynamic demonstration of standard deviation showing dispersion with multiple line segments connecting specific points and displaying variance, suitable for high school probability and statistics teaching.
The prompt above was compiled from the original drawing commands and is for reference only.