
Standard Deviation Calculation Demo
Loading the math board and drawing, please wait…
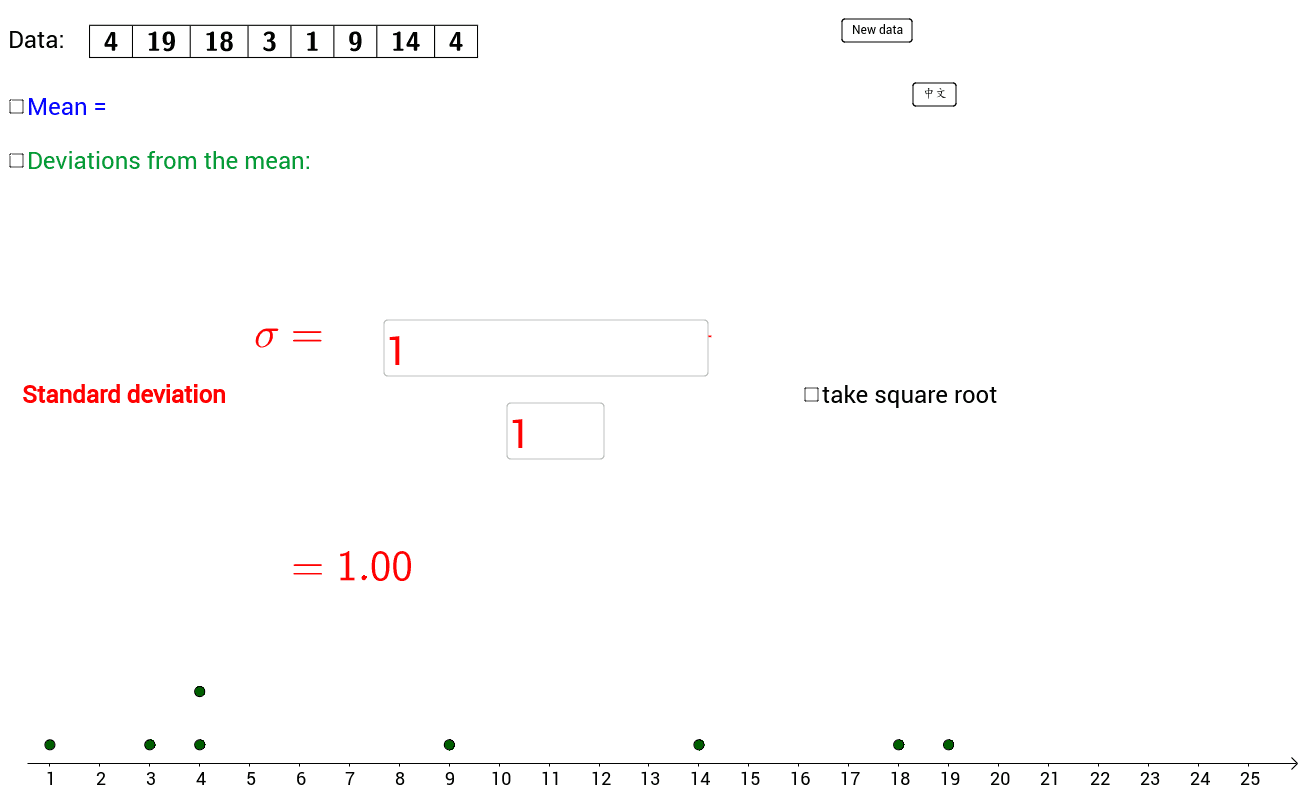
This example demonstrates how to dynamically calculate and visualize standard deviations of data using GeoGebra. It involves core math concepts like standard deviation, mean, data distribution, and probability & statistics. Construction highlights include commands like Random, Sequence, Mod, Append, TableText, DotPlot, Mean, Textfield, SD, Segment, If, and objects such as DataMax, DataMin, list1, listDot, etc., to create random datasets, plot dot plots, and display standard deviations. Suitable for high school students and math enthusiasts for probability & statistics education and learning.
GeoGebra Commands & Parameters
Random(NumberMin, NumberMax) → n1Sequence(Random[DataMin, DataMax], i, 1, n1) → list1Mod(Sum[list1], n2) → r1Append(n2 - r1, list1) → list2TableText({list2}, "c|_") → text2DotPlot(list2) → listDotMean(list2) → mMod(Sum[list2], n2) → r2Sequence(Segment[Element[listDot, i], (m, y(Element[listDot, i]))], i, 1, Length[listDot]) → listSegSequence(Element[list2, i] - m, i, 1, Length[list2]) → listDiffTableText({listDiff}, "c|_") → text3Textfield(f1) → inputBox1Textfield(f2) → inputBox2SD(list2) → sdSegment((m, 0), (m, 6)) → meanSegIf(Chinese, "數據:", "Data:") → text1If(Chinese, "正確!", "Correct!") → text7If(Chinese, "標準差", "Standard deviation") → text5a
AI Drawing Prompt Reference
Visualize dynamically calculating and visualizing standard deviations with randomly generated data points, mean line, and standard deviation lines, including data lists and text explanations, start by plotting data points and the mean line, then mark the standard deviation range, and finally display the data and calculation results.
The prompt above was compiled from the original drawing commands and is for reference only.