
Standard Deviation by Yoong Kheong
Loading the math board and drawing, please wait…
In collections
Continuous Random Variables
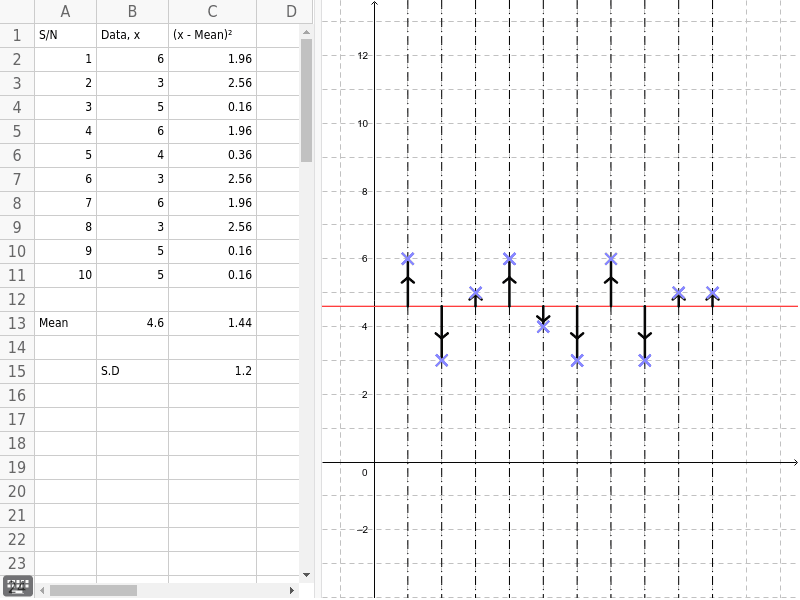
This example illustrates the concept of standard deviation, which measures the spread of data around the mean. By constructing data points, calculating the mean, and plotting the data distribution, it demonstrates how to use GeoGebra commands such as Point, Line, and Mean to build a standard deviation graph. Suitable for middle school and above students to learn about data dispersion in statistics.
GeoGebra Commands & Parameters
Point(xAxis) → Col_1Point(xAxis) → Col_2Point(xAxis) → Col_3Point(xAxis) → Col_4Point(xAxis) → Col_5Point(xAxis) → Col_6Point(xAxis) → Col_7Point(xAxis) → Col_8Point(xAxis) → Col_9Point(xAxis) → Col_{10}Line(Col_1, yAxis) → aLine(Col_2, yAxis) → bLine(Col_3, yAxis) → cLine(Col_4, yAxis) → dLine(Col_5, yAxis) → eLine(Col_6, yAxis) → fLine(Col_7, yAxis) → gLine(Col_8, yAxis) → hLine(Col_9, yAxis) → iLine(Col_{10}, yAxis) → jPoint(a) → pt_1Point(b) → pt_2Point(c) → pt_3Point(d) → pt_4Point(e) → pt_5Point(f) → pt_6Point(g) → pt_7Point(h) → pt_8Point(i) → pt_9Point(j) → pt_{10}Mean(B2:B11) → B13Mean(C2:C11) → C13Intersect(a, k) → Inter_ASegment(Inter_A, pt_1) → seg_1Intersect(b, k) → Inter_BIntersect(d, k) → Inter_DIntersect(f, k) → Inter_FIntersect(h, k) → Inter_HIntersect(j, k) → Inter_JSegment(Inter_B, pt_2) → seg_2Segment(Inter_J, pt_{10}) → b_1Intersect(c, k) → Inter_CIntersect(e, k) → Inter_EIntersect(g, k) → Inter_GIntersect(i, k) → Inter_ISegment(Inter_C, pt_3) → seg_3Segment(Inter_D, pt_4) → seg_4Segment(Inter_E, pt_5) → seg_5Segment(Inter_F, pt_6) → seg_6Segment(Inter_G, pt_7) → seg_7Segment(Inter_H, pt_8) → seg_8Segment(Inter_I, pt_9) → seg_9Segment(Inter_J, pt_{10}) → seg_{10}
AI Drawing Prompt Reference
Draw a set of data points and calculate their mean. Then, construct vertical lines from each data point to the x-axis and find their intersections with the mean line. Finally, connect these intersection points to form the standard deviation graph.
The prompt above was compiled from the original drawing commands and is for reference only.