
Squeeze Theorem: Geometric Intuition for Limits and Inequalities
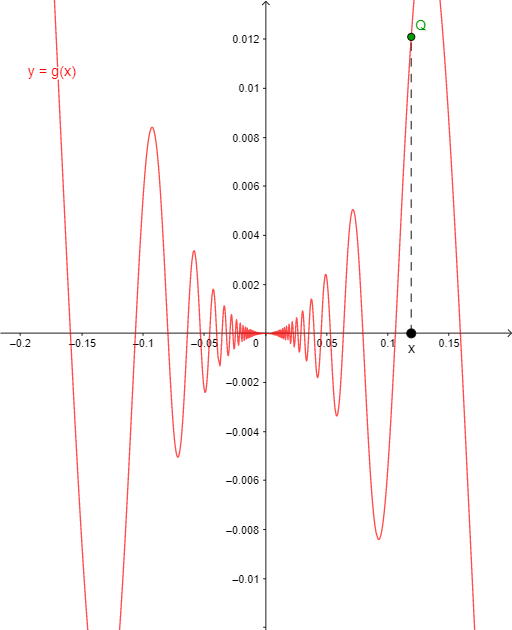
Loading the math board and drawing, please wait…
The Squeeze Theorem demonstrates the relationship between limits and inequalities using geometric figures. Key concepts include limits, squeezing, and inequalities. Construction involves GeoGebra commands such as Point, Segment, and Line_A. Suitable for high school students or college students learning calculus fundamentals.
GeoGebra Commands & Parameters
Point(xAxis) → XSegment(a, P) → Line_ASegment(X, Q) → h_2Point(xAxis) → wSegment(X_{1}, Q_{1}) → h_{1}
AI Drawing Prompt Reference
Draw a graph that illustrates the relationship between limits and inequalities. The graph should include a point X on the x-axis. Draw a line segment Line_A from point X, and another line segment h_2 parallel to point X. Then draw a point w on the x-axis. Draw a line segment h_1 from point X, parallel to point w. The line segments Line_A, h_1, and h_2 should form a squeezing relationship, representing the relationship between limits and inequalities.
The prompt above was compiled from the original drawing commands and is for reference only.