
Square Root Function Graph by Michael Bailey
Loading the math board and drawing, please wait…
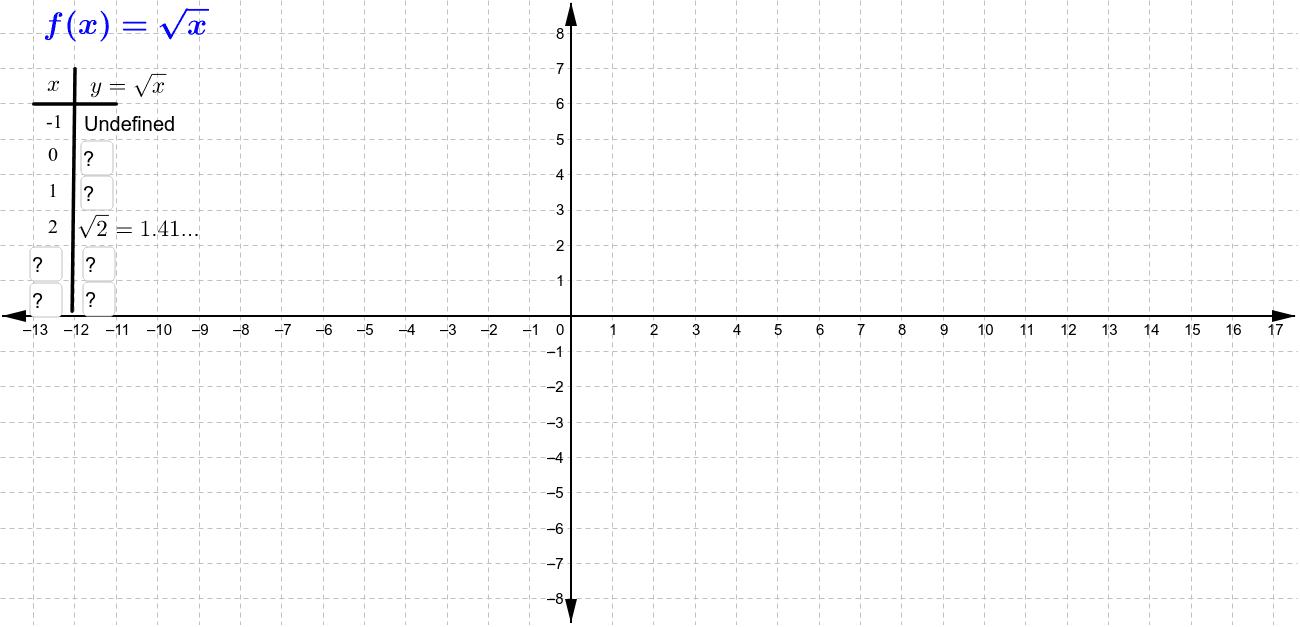
This example demonstrates the graph of the square root function. The square root function is a common function in mathematics, defined for non-negative real numbers. Using GeoGebra, we can visually observe the characteristics of the square root function's graph, including its monotonicity and asymptotes. The construction summary mentions the use of Segment, CurveCartesian, Point, Vector commands, which help in building the function graph. Suitable for high school mathematics education and learning.
GeoGebra Commands & Parameters
Segment(A, B) → aSegment(C, D) → bCurveCartesian(t, sqrt(t), t, 0, 9.1) → cPoint(c) → EPoint(c) → GVector(G, H) → vTextfield(a1) → inputBox1Textfield(a2) → inputBox2Textfield(a3) → inputBox3Textfield(a4) → inputBox4Textfield(a5) → inputBox5Textfield(a6) → inputBox6
AI Drawing Prompt Reference
Draw the graph of the square root function from 0 to 9.1. Start by plotting two points A and B, then draw a line segment AB. Next, plot a curve C representing y equals the square root of x. Take two points E and G on the curve, then draw a vector v from G to H. Finally, add six input boxes to input information about line segment AB, points E and G, and vector v.
The prompt above was compiled from the original drawing commands and is for reference only.