
Horizontal Translation Demo: Function Graphs and Vectors
Loading the math board and drawing, please wait…
In collections
Quadratic Functions and Transformations
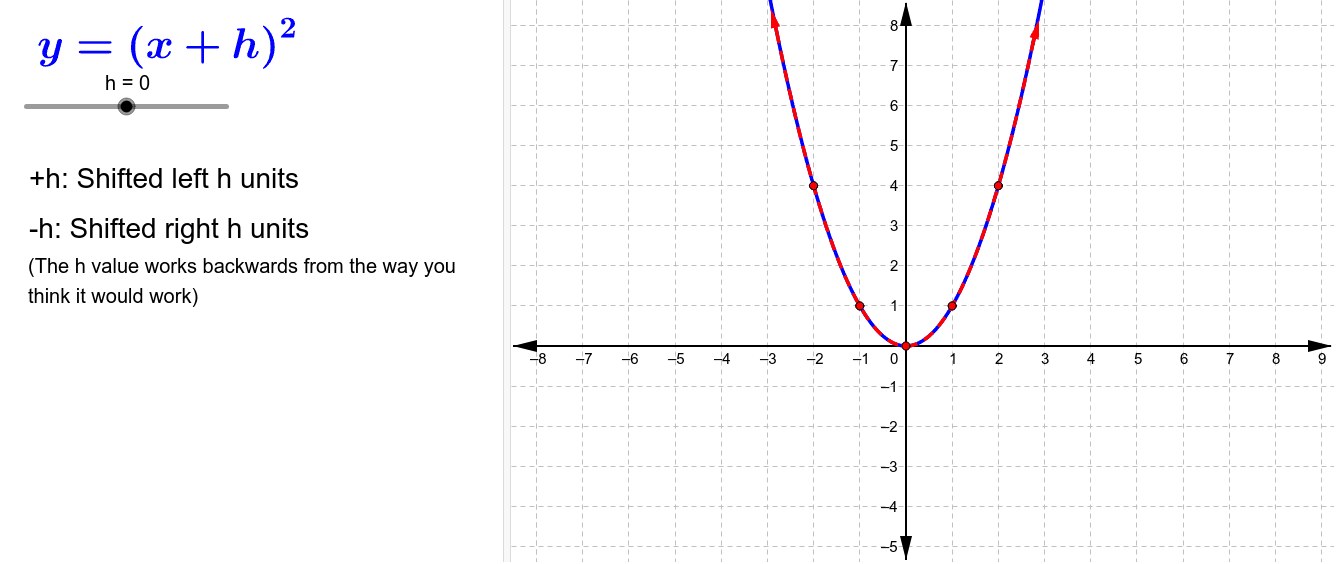
This example demonstrates horizontal translation of function graphs and their geometric interpretation. Core concepts involve function translation, vector representation of displacement, and coordinate geometry. Construction utilizes CurveCartesian for curves, Point objects for key locations, and Vector commands to visualize the shift. Suitable for high school math instruction or independent exploration of function properties, providing an intuitive understanding of how translation affects equations.
GeoGebra Commands & Parameters
CurveCartesian(t, t^(2), t, -2.8, 2.8) → f3Point(f3) → IVector(I, J) → h_1Point(f3) → KVector(K, L) → i
AI Drawing Prompt Reference
Draw a parabola graph with the equation y = x^2. Mark a point on the parabola to represent a location. Then, draw a vector from this point to show the direction and distance of a horizontal shift. Another point is marked on the parabola, and a vector is drawn from it to illustrate different shift effects. Ensure the graph is clear and labeled to help understand the impact of translation on the function graph.
The prompt above was compiled from the original drawing commands and is for reference only.