
Square Root Function Graph and Its Properties
Loading the math board and drawing, please wait…
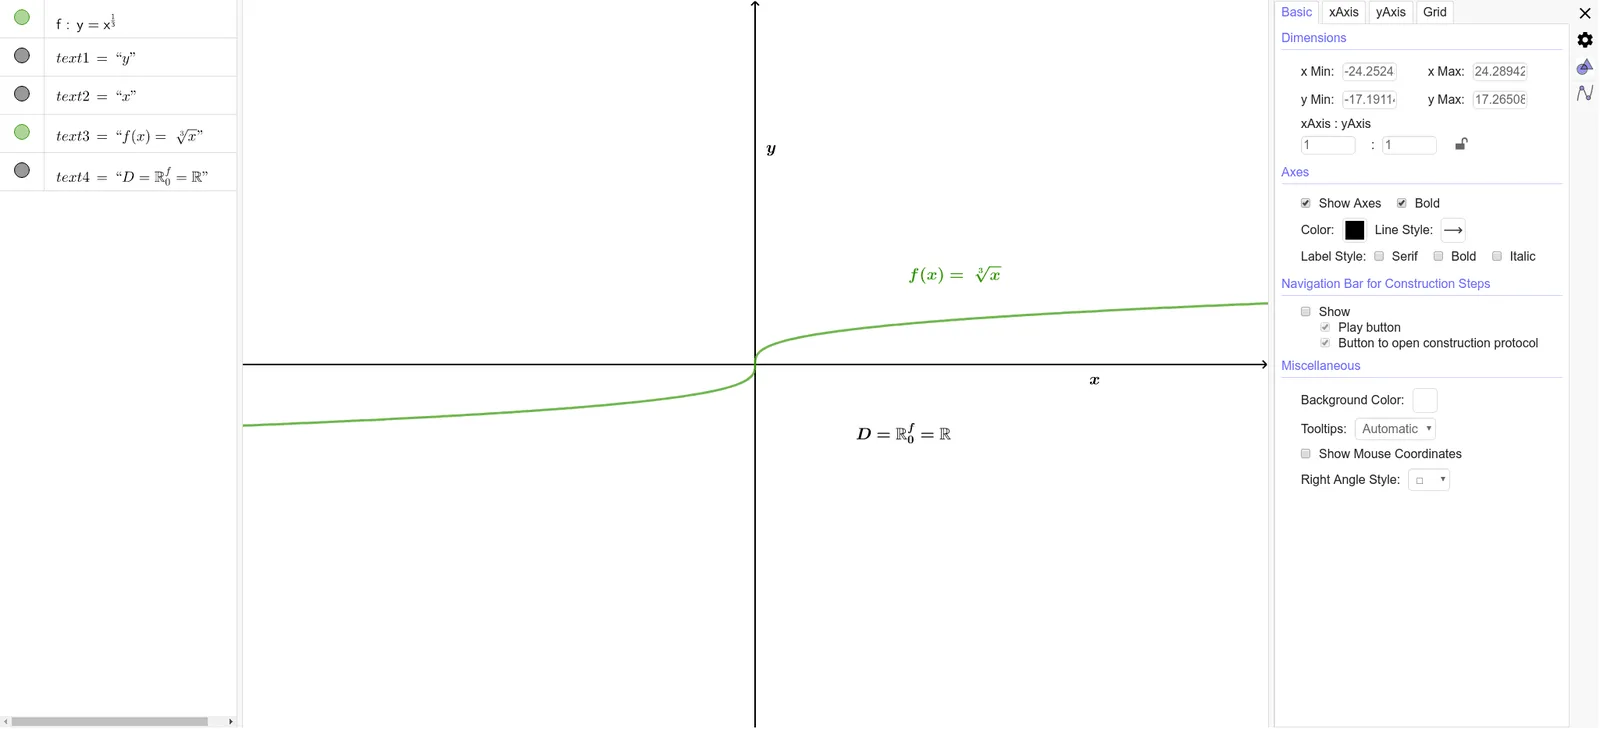
① This example visualizes the graph of the square root function y = sqrt(x), illustrating its shape, domain, and range on the coordinate plane. ② Core mathematical concepts include the definition and notation of the square root function, curve sketching, and an introductory link to its derivative. ③ The construction uses GeoGebra objects such as the function f(x) = sqrt(x) and text labels (text1‑text4) to annotate key points, with optional sliders for interactivity. ④ It is intended for high‑school algebra and pre‑calculus students, as well as for middle‑school enrichment activities to deepen understanding of square root functions.
GeoGebra Commands & Parameters
f: y = x^(1 / 3)
AI Drawing Prompt Reference
Draw the graph of the square root function y = sqrt(x), indicating its domain and range. Add text labels to annotate key points such as the function definition, curve shape, and range. Use sliders to adjust the display range of the function.
The prompt above was compiled from the original drawing commands and is for reference only.