
Square Root Function Demonstration
Loading the math board and drawing, please wait…
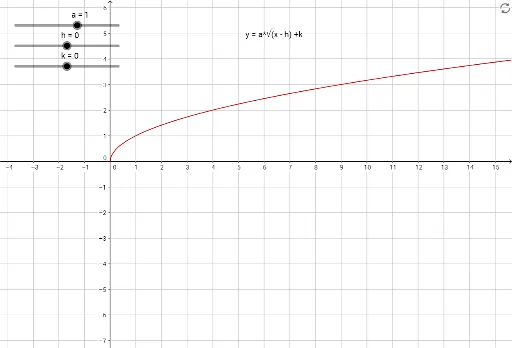
This example demonstrates the graph of the square root function and its variations. It involves core math concepts like functions, parabolas, expected value, multiplication, confidence intervals, and linear programming. Construction highlights include GeoGebra objects: a (point), h (horizontal shift), k (vertical shift), f (function), text1 (text). Suitable for high school and above, ideal for understanding function transformations and statistical applications.
GeoGebra Commands & Parameters
Numeric a(1)Numeric h(0)Numeric k(0)f(x) = (a * sqrt(x - h)) + k
AI Drawing Prompt Reference
Draw the graph of a square root function with horizontal shift h and vertical shift k. First, set a positive number a as the scaling factor, then plot the function f(x) = a * sqrt(x - h) + k based on the values of a, h, and k. Observe the graph's shift by adjusting the values of h and k.
The prompt above was compiled from the original drawing commands and is for reference only.