
Square Root Domain and Range
Loading the math board and drawing, please wait…
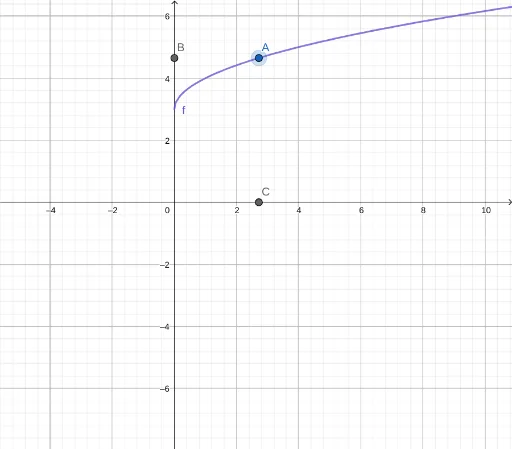
This example demonstrates the graphical representation of the domain and range of a square root function. It involves core mathematical concepts such as square root functions, domain, range, and coordinate geometry. The construction uses GeoGebra commands like Point, OrthogonalLine, Intersect, Root, and Extremum. Suitable for high school mathematics education to understand function graphs and properties.
GeoGebra Commands & Parameters
Point(f) → AOrthogonalLine(A, xAxis) → gOrthogonalLine(A, yAxis) → hIntersect(h, yAxis) → BIntersect(g, xAxis) → CRoot(f) →Extremum(f) →Extremum(f) →Extremum(f) →
AI Drawing Prompt Reference
Draw the graph of a square root function, showing its domain and range. Start with the curve, then place a point on it. From this point, draw perpendicular lines to the x-axis and y-axis, marking their intersections with the axes. Also indicate the root (where the curve meets the x-axis) and the extremum (minimum point) of the function. The final figure includes the curve, the perpendicular lines, the axis intersection points, and the key points, illustrating the domain and range of the square root function.
The prompt above was compiled from the original drawing commands and is for reference only.