
Sphere and Conditional Probability Visualization
Loading the math board and drawing, please wait…
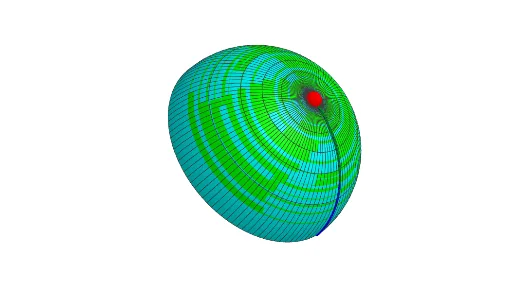
This example demonstrates how to visualize the combination of spherical surfaces and conditional probability through dynamic graphics, involving core mathematical concepts such as sphere, tree diagrams, cosine function, stochastic processes, and hyperbolas. Construction highlights include using commands and objects like PointIn, Angle, CurveCartesian, Rotate, Surface in GeoGebra. Suitable for high school students and learners interested in probability & statistics and solid geometry.
GeoGebra Commands & Parameters
PointIn(Sphere[(0, 0, 0), 1]) → PAngle((1, 0), (0, 0), (x(P), y(P))) → a1CurveCartesian(t, 0, sqrt(1 - t^(2)), t, 0, n) → cRotate(c, (-a2), yAxis) → c'Rotate(c', a1, zAxis) → c''CurveCartesian(sin((t * π)), 0, cos((t * π)), t, 0, m) → bRotate(b, (-a2), yAxis) → b'Rotate(b', a1, zAxis) → b''Surface(c'', (2 * π), Line[(0, 0, 0), P]) → scSurface(b'', (2 * π), Line[(0, 0, 0), P]) → sb
AI Drawing Prompt Reference
Draw a unit sphere centered at the origin. Pick a random point on the sphere's surface and draw a ray from the center to that point. Construct two curves on the sphere: one is a semicircular arc in the horizontal plane, and the other is a semicircle along a meridian. Rotate each of these curves around the ray by a full turn to generate two surfaces of revolution, one resembling a spherical cap and the other a cone-like shape. Also show an angle marker at the center indicating the point's direction, and visualize the concept of conditional probability through the dynamic rotation and angle changes.
The prompt above was compiled from the original drawing commands and is for reference only.