
Solving Systems of Equations by Graphing
Loading the math board and drawing, please wait…
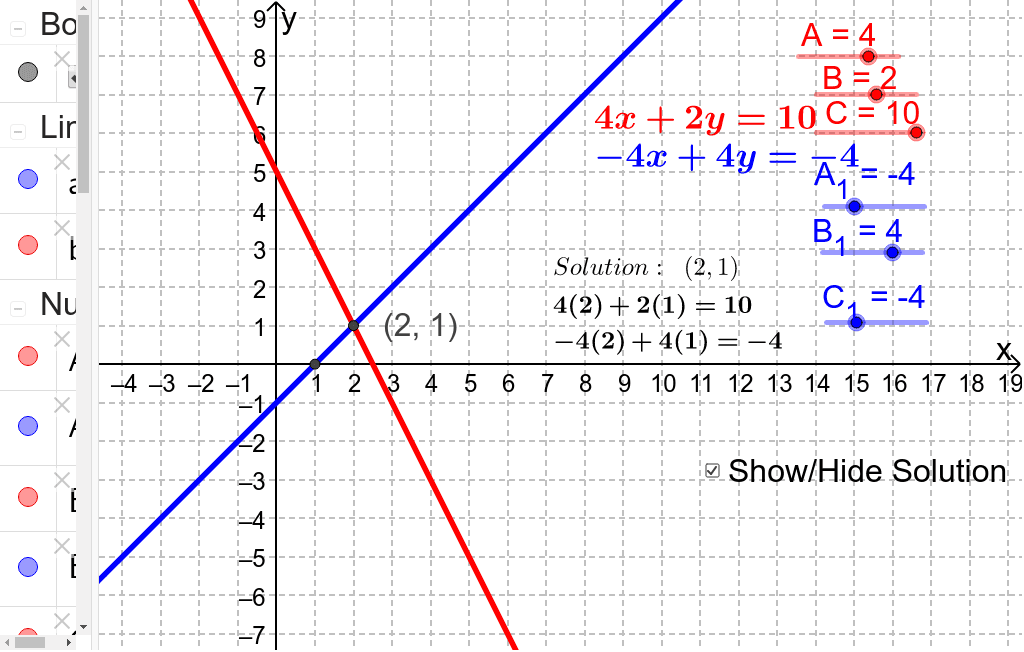
This GeoGebra example illustrates that the point of intersection of two lines is a solution to both lines' equations. It involves core concepts of linear equations and functions. Using commands like Point and Intersect, you can construct lines and observe their intersection points. Suitable for students in middle school and above to learn about systems of linear equations.
GeoGebra Commands & Parameters
Point(yAxis) → C_2Point(yAxis) → DPoint(yAxis) → EPoint(yAxis) → FPoint(yAxis) → GPoint(xAxis) → HPoint(xAxis) → IPoint(xAxis) → JIntersect(yAxis, b) → KIntersect(b, xAxis) → LIntersect(b, a) → MIntersect(a, yAxis) → NIntersect(a, xAxis) → OPoint(a) → PPoint(b) → Q
AI Drawing Prompt Reference
Draw two lines that intersect at a point in a coordinate system. The lines should extend from the origin to points on the axes. Ensure that they overlap at the intersection point. Keep the graph simple and focused on the relationship between the lines.
The prompt above was compiled from the original drawing commands and is for reference only.