
Solving Nonlinear Systems of Equations: 2 Variables
Loading the math board and drawing, please wait…
In collections
Solution of Systems of nonlinear Equations
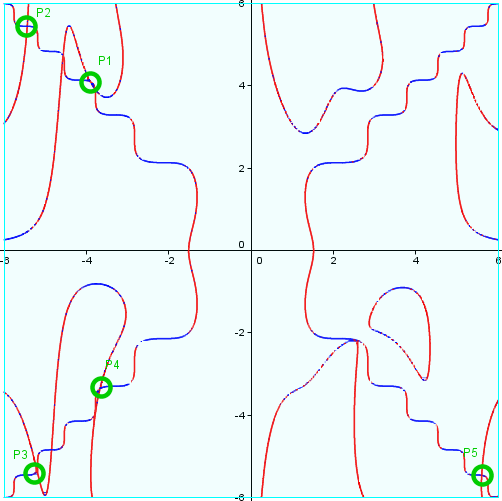
This example demonstrates the graphical and numerical solution of a system of two nonlinear equations. It involves key mathematical concepts such as solving nonlinear equations, coordinate geometry, and numerical computation. Using GeoGebra commands like Element, Point, If, Textfield, etc., a dynamic graphical representation of the solution to the nonlinear system is constructed. Suitable for high school mathematics education and learning.
GeoGebra Commands & Parameters
Element(lP, i) → P_iPoint(Segment[Px2, Px1]) → AxPoint(Segment[Py2, Py1]) → AyIf(Funktion ≟ 1, a(x, y), If[Funktion ≟ 2, b(x, y), (a(x, y) * b(x, y))]) → f00If(((f1(x0 - ε / 2) * f1(x0 + ε / 2)) < 1.0E-8) ∧ ((f2(x0 - ε / 2) * f2(x0 + ε / 2)) < 1.0E-8), (x0, y0)) → E0xIf(((g1(y0 - ε / 2) * g1(y0 + ε / 2)) < 0) ∧ ((g2(y0 - ε / 2) * g2(y0 + ε / 2)) < 0), (x0, y0)) → E0yTextfield(a) → inputBox1Textfield(b) → inputBox2Polygon((x_{max}, y_{max}), (x_{min}, y_{max}), (x_{min}, y_{min}), (x_{max}, y_{min})) → VV, d, e, g, hTextfield(N_P) → Textfeld1If(a_1, N_P, 2) → N_1Sequence(x_{min} + ((x_{max} - x_{min}) / N_1 * i), i, 0, N_1) → xxSequence(y_{min} + ((y_{max} - y_{min}) / N_1 * i), i, 0, N_1) → yyRemoveUndefined(Join[Zip[Mirror[{Roots[f00(a, x), y_{min}, y_{max}]}, y = x] + (a, 0), a, xx]]) → PxxyJoin(Zip[Reverse[{Roots[f00(x, b), x_{min}, x_{max}]}] + (0, b), b, yy]) → PyyxTextfield(Funktion) → Textfeld2Textfield(x_{min}) → Textfeld3Textfield(y_{min}) → Textfeld4Textfield(x_{max}) → Textfeld5Textfield(y_{max}) → Textfeld6Text(Element[L, 1]) → LxText(Element[L, 2]) → LyIntersect(Element[L, 1], Element[L, 2]) → CZip((a(x(pp), y(pp)), b(x(pp), y(pp))), pp, lP) → Liste1
AI Drawing Prompt Reference
Draw the graph of a system of two nonlinear equations, input the two equations, set the minimum and maximum values for x and y, generate the corresponding function graphs, find the intersection points, and display the coordinates of the intersection points.
The prompt above was compiled from the original drawing commands and is for reference only.