
Solving Linear Equations Graphically & Symbolically by Judah L Schwartz
Loading the math board and drawing, please wait…
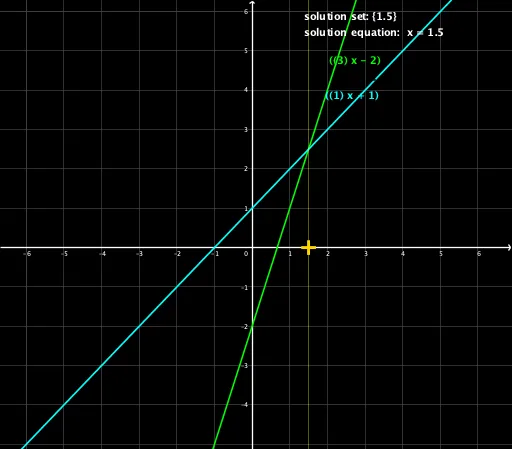
This example demonstrates solving linear equations using both graphical and symbolic methods. It covers key mathematical concepts such as the geometric representation of linear equations and algebraic solutions. Using GeoGebra commands like Intersect, Point, and Polynomial, it dynamically illustrates the solutions to linear equations. Suitable for students at the middle school level and above.
GeoGebra Commands & Parameters
Intersect(g, f) → CPoint(yAxis) → DPoint(yAxis) → EPoint(c) → FPolynomial({D, F}) → hPolynomial({E, F}) → pTextfield(m) → InputBox1Textfield(b) → InputBox2Textfield(M) → InputBox3Textfield(B) → InputBox4
AI Drawing Prompt Reference
Draw two lines, show their intersection point, and mark two points on the coordinate axis. Draw two new lines from the intersection point to these two points, and label their equations. Finally, display two text boxes on the coordinate axis to input the values of m and b.
The prompt above was compiled from the original drawing commands and is for reference only.