
Slope Fields and Euler's Method: Interactive Visualization of Differential Equat
Loading the math board and drawing, please wait…
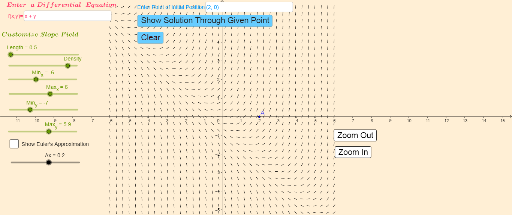
This GeoGebra example demonstrates how to visualize first-order differential equations using slope fields and approximate solutions via Euler's method. The core mathematical concepts include differential equations, slope fields, numerical integration, step size, and error analysis. The construction uses GeoGebra commands such as Textfield and SlopeField to create an interactive interface, with sliders or input boxes controlling the function f, slope field density, and the x/y ranges (Min_x, Max_x, Min_y, Max_y). Buttons (button1 to button9) trigger Euler iterations, generating points A, A1 to A5 and corresponding Δy increments, and finally plotting the Euler polygonal path. This tool is suitable for high school seniors or university students beginning differential equations, helping them understand the relationship between slope fields and numerical solutions, explore the effect of step size on accuracy, and serve as a classroom demonstration aid.
GeoGebra Commands & Parameters
Textfield(f) → InputBox1SlopeField(f(x, y), Density, Length, Min_x, Min_y, Max_x, Max_y) → slopefield1Textfield(A) → InputBox2
AI Drawing Prompt Reference
Create a visualization for first-order differential equations featuring an input box for function f, a slope field area based on f with adjustable density and range, and an input box to mark point A. The slope field should allow interactive exploration, and controls should demonstrate Euler's method iterations starting from A, generating points A1 to A5 and drawing a polygonal path connecting them to show the numerical solution.
The prompt above was compiled from the original drawing commands and is for reference only.