
Sliding Point and Line Coefficient Changes by Tiffany Stellhorn (2)
Loading the math board and drawing, please wait…
In collections
What's Going On?
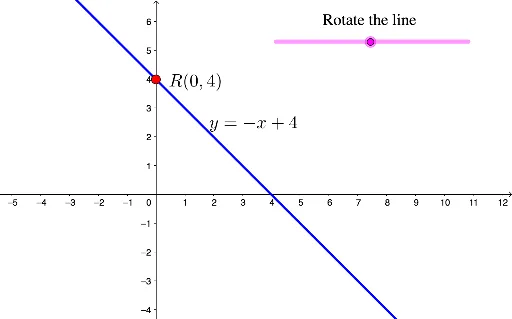
This example demonstrates how the coefficients of a line's equation change as a point slides up and down the y-axis. It involves core math concepts like linear functions, coordinate geometry, and coefficient sensitivity. Construction uses commands such as Point, Circle, Intersect, and objects like A, a, B, text elements, and rotation. Suitable for high school mathematics education to understand the relationship between line equations and parameter variations.
GeoGebra Commands & Parameters
Point(yAxis) → APoint(a) → BCircle(A, 2) → cIntersect(c, a, 2) → C
AI Drawing Prompt Reference
Draw a line sliding along the y-axis to show coefficient changes. Include a point moving on the y-axis, a circle centered at this point with radius 2. Find the intersection points of the circle with the y-axis and display how these points change as the y-axis point moves, illustrating the relationship in linear functions and coordinate geometry for understanding coefficient sensitivity.
The prompt above was compiled from the original drawing commands and is for reference only.