
Sine Transformations: Graph Transformations
Loading the math board and drawing, please wait…
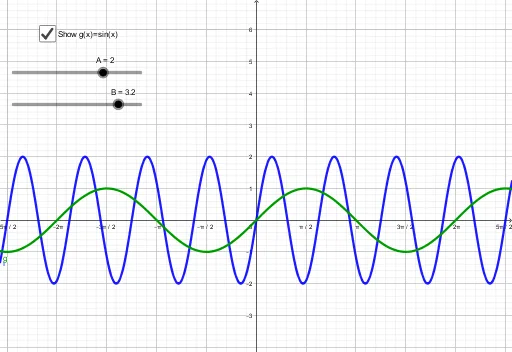
This example demonstrates the transformation of sine function graphs through translation and scaling. Key mathematical concepts include function translation, scaling ratios, and periodicity. Construction involves GeoGebra commands A, B, f, g, a to create transformed graphs. Suitable for high school mathematics courses or graph analysis exercises.
GeoGebra Commands & Parameters
Numeric A(2.0)Numeric B(3.2)f(x) = (A * sin((B * x)))g(x) = sin(x)Boolean a(true)
AI Drawing Prompt Reference
Draw a coordinate plane with two sine curves. One is the standard sine curve, and the other is a transformed version with a larger amplitude (about twice) and a shorter period (about one-third). Both curves start at the origin and extend along the x-axis. Include a toggle button to show or hide the transformed curve. Label the axes clearly and use distinct colors for the two curves to highlight the effects of scaling and translation.
The prompt above was compiled from the original drawing commands and is for reference only.