
Sine Sounds: Visualizing Sine Waves and Their Mathematical Link to Sound
Loading the math board and drawing, please wait…
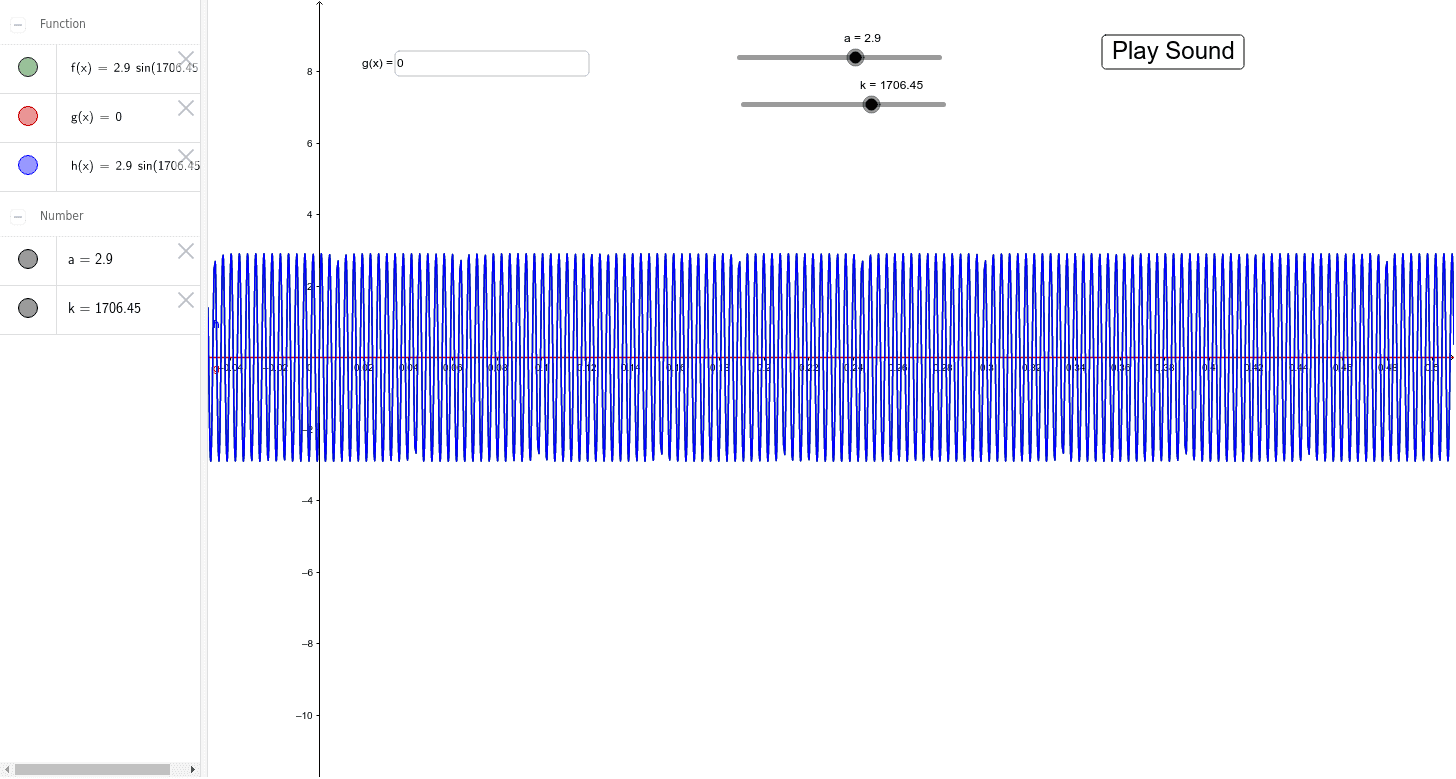
This GeoGebra example demonstrates the direct connection between sine functions and sound waves through an interactive visual and auditory experience. It transforms abstract trigonometric concepts into a dynamic, perceivable phenomenon. Core mathematical concepts include periodicity, amplitude, frequency, and phase of sine waves, as well as the role of similar triangles in relating the unit circle to the sine curve. The construction uses a text field (Textfield) and an input box (InputBox1) for user-defined parameters, a button (button1) to trigger animations, and sliders (a, k) to control amplitude and frequency. Multiple function objects (f, g, h) are plotted to show symmetry, straight lines, and scalene triangle relationships. This resource is ideal for high school or early college students, suitable for trigonometry lessons, introductory acoustics, or interdisciplinary projects linking mathematics and music. It helps learners grasp how sine waves form the fundamental building blocks of sound.
GeoGebra Commands & Parameters
Textfield(g) → InputBox1