
Sine Function Transformation by Michael PArk
Loading the math board and drawing, please wait…
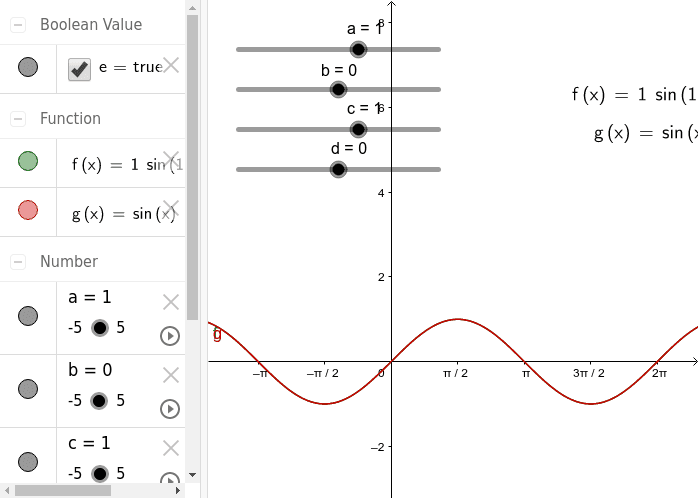
This example demonstrates the effects of translations and scalings on the sine function graph. It involves core math concepts like sine function properties and graph transformation rules. Construction highlights include using GeoGebra commands LaTeX for text objects text1, text2, and defining variables a, b, c, d, f, g with Slider animations to visualize transformations. Suitable for high school mathematics teaching to understand how graph transformations affect function characteristics.
GeoGebra Commands & Parameters
LaTeX(g, true, true) → text1LaTeX(f, true, true) → text2
AI Drawing Prompt Reference
Draw a sine function graph and demonstrate its transformation effects through translations and scalings. Use sliders to animate variables a, b, c, d, f, g to show their impact on the function's characteristics, and include text labels in the graph indicating the values of these variables to help understand graph transformation rules.
The prompt above was compiled from the original drawing commands and is for reference only.