
Sine Function Demonstration by Richard Wade
Loading the math board and drawing, please wait…
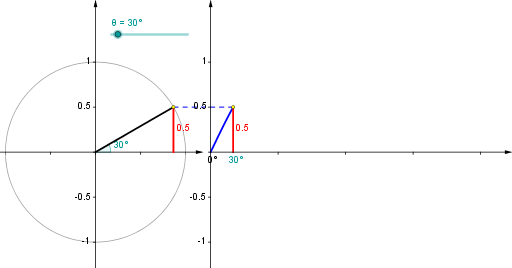
This example dynamically demonstrates the sine function's graph and its relationship with the unit circle. It involves core math concepts like trigonometry, unit circle, angles, vectors, and function graphing. Construction highlights include commands/objects like Point, Rotate, Angle, Function, Segment, Circle, Vector, and Sequence. Suitable for high school mathematics teaching to understand the generation and properties of sine function graphs.
GeoGebra Commands & Parameters
Point(Ray[(0, 0), (-1, 0)]) → BRotate(A, θ, B) → PRotate(A, θ, B) → A'Angle(A, B, A') → αRotate(A, θ, B) → A'_1Angle(A, B, A'_1) → βFunction(sin((120° * x)), 0, x(Q)) → fSegment(Q, (x(Q), 0)) → eCircle(B, A) → cSegment(B, P) → aVector((x(B), y(Corner[1])), (x(B), y(Corner[4]))) → uVector((0, y(Corner[1])), (0, y(Corner[4]))) → wVector((0, 0), (x(Corner[2]), 0)) → zSequence(Segment[((0.75 * i), 0), ((0.75 * i), -0.025)], i, 1, 4) → list1Segment(P, (x(P), 0)) → bVector(B - (1.2, 0), B + (1.2, 0)) → vSequence(Segment[(0, (0.5 * i) - 1), (-0.025, (0.5 * i) - 1)], i, 0, 4) → list2Sequence(Segment[(x(B), (0.5 * i) - 1), (x(B) - 0.025, (0.5 * i) - 1)], i, 0, 4) → list3Segment(P, Q) → dSequence(Segment[B + ((0.5 * i) - 1, 0), B + ((0.5 * i) - 1, -0.025)], i, 0, 4) → list4Point(Ray[(0, 0), (-1, 0)]) → B_1Rotate(A_1, θ, B_1) → P_1Rotate(A_1, θ, B_1) → A'_2Rotate(A_1, θ, B_1) → A'_3Circle(B_1, A_1) → c_1Segment(B_1, P_1) → a_1
AI Drawing Prompt Reference
Create a dynamic illustration showing the relationship between the sine function graph and the unit circle. Display a point rotating around the unit circle, connecting it to the center to form a vector, and projecting it onto the axes. Simultaneously plot the sine function graph, using auxiliary line segments and markings to clearly illustrate the connection between angles, vectors, and function values. Include a slider to control the rotation angle, suitable for teaching the generation process of the sine function.
The prompt above was compiled from the original drawing commands and is for reference only.