
Sine Curve - Amplitude and Period
Loading the math board and drawing, please wait…
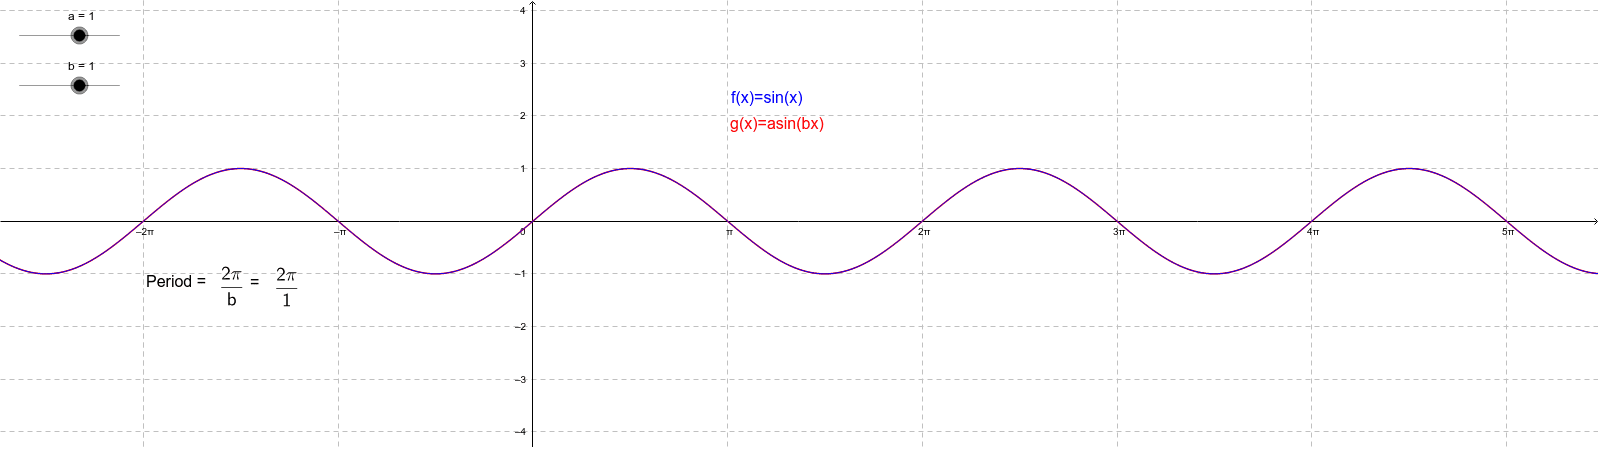
This example demonstrates the variation of amplitude and period in a sine curve. It involves core mathematical concepts such as the sine function, amplitude, period, and coordinate geometry. The construction utilizes GeoGebra commands like objects a, b, c, d, text2, f, text1, text3, text4, text5, text6, text7, text8, text9, text10, g, text11, text12. It is suitable for high school students and teachers for teaching and understanding function graph transformations.
GeoGebra Commands & Parameters
Numeric a(1.0)Numeric b(1.0)Numeric c(0.0)Numeric d(0.0)f(x) = a * sin(b * x - c) + dg(x) = sin(x)
AI Drawing Prompt Reference
Draw a Cartesian coordinate plane with two sine curves. One is the standard sine curve, and the other is a modified sine curve whose amplitude, period, and phase can be adjusted via sliders. The standard curve serves as a reference, while the adjusted curve clearly demonstrates changes in amplitude and period. Both curves are smooth and continuous, with key points marked to aid understanding of function graph transformations.
The prompt above was compiled from the original drawing commands and is for reference only.