
Sign Diagram Demo
Loading the math board and drawing, please wait…
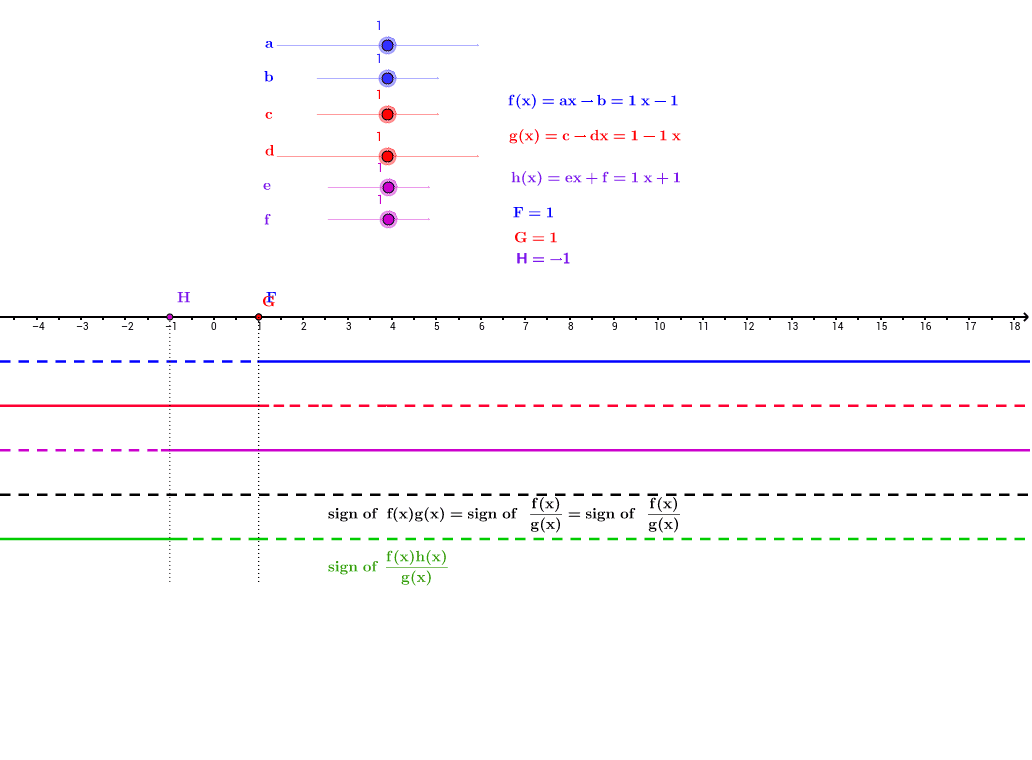
This example demonstrates how to use a sign diagram to analyze the positivity and negativity of functions across different intervals. It involves core math concepts like inequalities, subtraction, power functions, squares, and real numbers. Constructed using GeoGebra commands such as Intersect, Segment, and If, it is suitable for high school mathematics teaching to help students understand function properties and inequality solving methods.
GeoGebra Commands & Parameters
Intersect(g, y = 0) → ASegment(A, C) → pIntersect(f_2, y = 0) → BSegment(B, D) → qIf(f_2(x) < 0, fneg) → q_1If(f_2(x) > 0, fpos) → rIf(seco(x) < 0, gneg) → sIf(seco(x) > 0, gpos) → tIf(f_2(x) * seco(x) < 0, ftimesgneg) → f_1If(f_2(x) * seco(x) > 0, ftimesgpos) → g_1Intersect(seco, y = 0) → E_1Segment(E_1, F) → jIf(f_2(x) * h_1(x) / seco(x) < 0, treneg) → r_1If(f_2(x) * h_1(x) / seco(x) > 0, trepos) → s_1If(h_1(x) < 0, hneg) → t_1If(h_1(x) > 0, hpos) → g_2Intersect(h_1, y = 0) → ESegment(E, G) → e