
Shifted Sine Function
Loading the math board and drawing, please wait…
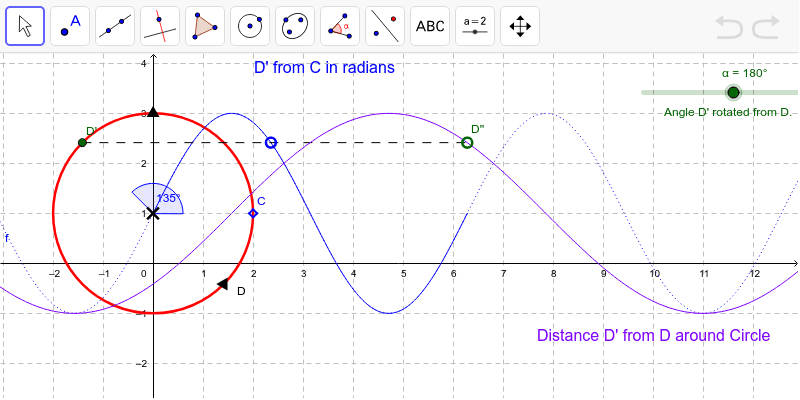
This example demonstrates the effect of shifting the sine function. It involves core math concepts like sine function, translation transformation, and trigonometric function graph transformations. Constructed using GeoGebra commands and objects such as Point, Corner, Circle, Rotate, Locus, Segment, Function, Angle. Suitable for high school students learning about trigonometric function graph transformations and for mathematical teaching demonstrations.
GeoGebra Commands & Parameters
Point(x = 0) → APoint(x = x(A)) → BCorner(5) → A_1Circle(A, B) → cPoint(c) → DRotate(D, α, A) → D'Locus(D'', α) → loc1Segment(D', D'') → aFunction((Distance[A, B] * sin(x)) + y(A), 0, 6.283185307179586) → hAngle(C, A, D') → β
AI Drawing Prompt Reference
Draw a graph demonstrating the effect of shifting the sine function, including a sine curve, a circle constructed from a point and its x-axis projection, a point on the circle rotating around the initial point forming a locus, and a line segment connecting the rotating point. Combine the amplitude of the sine function and the rotation angle to show the translation transformation of the function graph, with a slider controlling the rotation angle.
The prompt above was compiled from the original drawing commands and is for reference only.