
Seeing Multiplication: Interactive Visualizing Multiplication with Dynamic Geome
Loading the math board and drawing, please wait…
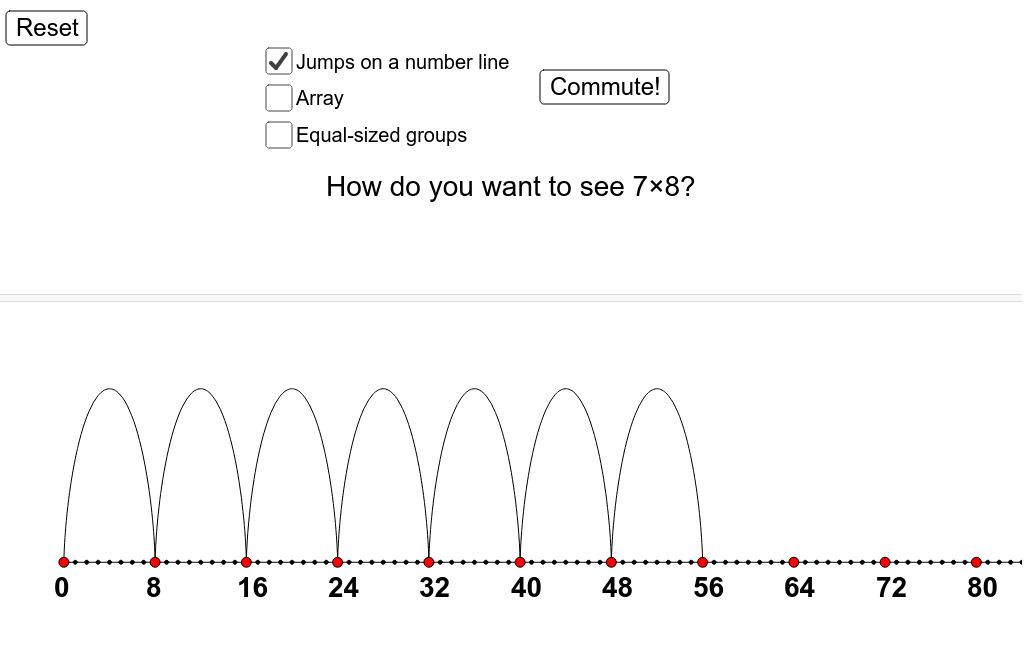
① This example demonstrates how multiplication can be visualized geometrically through interactive arrays, dots, and circles, allowing learners to literally 'see' the product of two numbers. ② Core mathematical concepts include multiplication, ratios, inequalities, orthocenter, and differential equations, but the primary focus is on the visual representation of multiplication and proportional relationships, where changing input values alters the array size, dot distribution, and segment lengths. ③ Construction highlights: using GeoGebra commands such as Textfield, InputBox, button, Sequence, Segment, Max, First, and CurveCartesian to create dynamic arrays and curves; objects like a1, a2, step, array, lineDots, groupCircles, and timers enable interactive controls and animated transitions. ④ Suitable for upper elementary to middle school students to grasp multiplication concepts, and for teachers to demonstrate the connection between arithmetic and geometry (e.g., rhombus, circles) through sliders and input boxes, fostering visual-mathematical thinking.
GeoGebra Commands & Parameters
Textfield(a1text) → InputBox2Textfield(a2text) → InputBox1If(a1 < 5, 1, If[a1 < 9, 2, 3]) → groupLayoutSizesSequence(Element[Flatten[Sequence[Sequence[Point[{(4.5 / groupLayoutSizes * i), (9 / groupLayoutSizes * j)}], i, 0, a1 - 1], j, 0, groupLayoutSizes - 1]], k], k, 1, (a1 * groupLayoutSizes), groupLayoutSizes) → groupCentersSequence(Point[{i, 0}], i, 0, ((2 * a1) * a2), a2) → lineDotsSegment(Element[lineDots, 1], (2 * Element[lineDots, Length[lineDots]])) → lineSequence(Point[{i, 0}], i, 0, line) → linemarksMax(a1, a2) → arraySizeIf(b, a1 + ((0.5 * arraySize) * sqrt(a2 / a1)), If[a, ((1.5 * a1) * a2), If[c, (5 * a1 / groupLayoutSizes), 10]]) → rightIf(b, ((-0.05 * arraySize) * sqrt(a1 / a2)), If[a, (-0.5 * a2 / π), If[c, -2, 0]]) → bottomSequence(Sequence[Polygon[(i, j), (i + 1, j), 4], i, 0, a1 - 1], j, 0, a2 - 1) → arrayFirst(Element[array, 1], arrayTimer1) → firstArrayFirst(array, arrayTimer2) → secondArrayCurveCartesian((a2 / ((2 * π)) * (t - sin(t))), (a2 / ((2 * π)) * (1 - cos(t))), t, 0, jumpTimer) → dIf(b, ((-0.5 * arraySize) * sqrt(a2 / a1)), If[a, ((-0.1 * a1) * a2), If[c, (-a1), -10]]) → leftIf(b, a2 + ((0.05 * arraySize) * sqrt(a1 / a2)), If[a, (1.5 * a2 / π), If[c, (groupLayoutSizes * 3), 10]]) → topFirst(Sequence[Circle[Element[groupCenters, i], 1.25], i, 1, Length[groupCenters]], circleTimer) → groupCirclesFirst(Flatten[Sequence[Sequence[Element[groupCenters, i] + ((1 - a2) / a2 * (cos(((2 * π / a2) * j)), sin(((2 * π / a2) * j)))), j, 0, a2 - 1], i, 1, Length[groupCenters]]], dotTimer) → groupDotsSequence(Text[x(Element[lineDots, i]), Element[lineDots, i] + (((-right)) / 100, bottom / 2.5)], i, 1, Length[lineDots]) → lineText
AI Drawing Prompt Reference
Create an interactive multiplication visualization with two adjustable numbers, using arrays of dots and circles to show the product. The central part features a dynamic grid that changes size based on the input values, with dots of varying colors and sizes representing the multiplication result. Include two lines with markers whose lengths relate to the input numbers. Surround the grid with dynamically changing circles and curves to illustrate proportional relationships. The design should emphasize the geometric interpretation of multiplication and ratios, suitable for educational purposes.
The prompt above was compiled from the original drawing commands and is for reference only.