
Section 2.5: Intermediate Value Theorem Visualization
Loading the math board and drawing, please wait…
In collections
Calculus 1 Graphical Illustrations
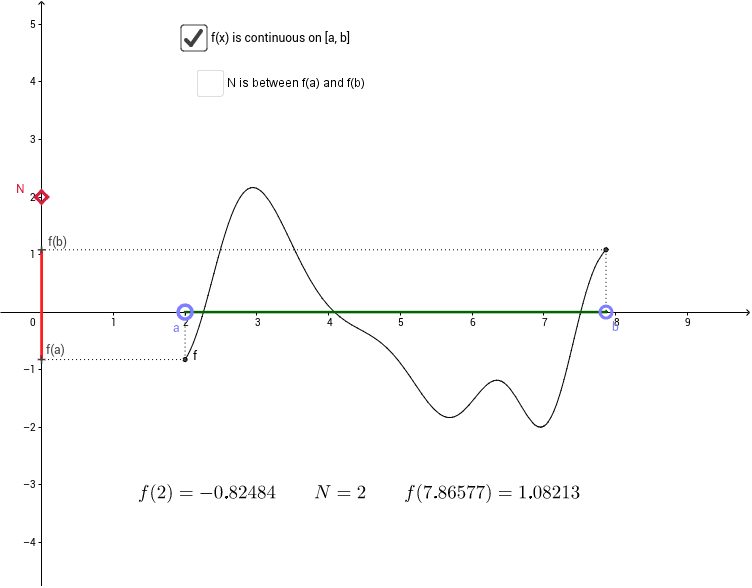
① This GeoGebra example visually demonstrates the Intermediate Value Theorem from calculus, showing that a continuous function on a closed interval takes every value between its endpoint values. ② Core mathematical concepts include continuity, closed intervals, function values, existence of zeros, and the geometric interpretation of the theorem. ③ Construction details: Based on the summary, it uses GeoGebra commands such as Point, Segment, and Intersect, creating a function f, multiple points (A, B, D, E, F, etc.), segments, and auxiliary lines. Intersection points are used to mark where the function equals a target value, with text objects (text1, text2) and images (pic1, pic2) likely illustrating the proof or applications. ④ Suitable for introductory calculus courses at university level or advanced high school mathematics, helping students grasp the property of continuous functions and the theorem's intuitive proof, and serving as an effective classroom demonstration tool.
GeoGebra Commands & Parameters
Point(xAxis) → BPoint(xAxis) → ASegment(C_1, A) → aSegment(D, B) → bSegment(D, F) → cSegment(C_1, E) → dSegment(F, E) → eSegment(A, B) → gPoint(yAxis) → NIntersect(h, f, x(A), x(B)) → G, H, R, I, J, K, L, M, O, P, QSegment(C, G) → kSegment(G, N) → l
AI Drawing Prompt Reference
Draw a continuous curve on a coordinate plane. Place two points on the x-axis as endpoints of a closed interval, and connect them with a horizontal segment. Mark a point on the y-axis, then draw vertical segments from it to several intersection points on the curve where the function equals a target value. Add two auxiliary points near the curve, connecting them to the interval endpoints and intersections with line segments. Finally, label the key intersections with text and include two small diagrams illustrating how the function crosses the target value, demonstrating the intermediate value theorem.
The prompt above was compiled from the original drawing commands and is for reference only.