
Sample P - Correlation
Loading the math board and drawing, please wait…
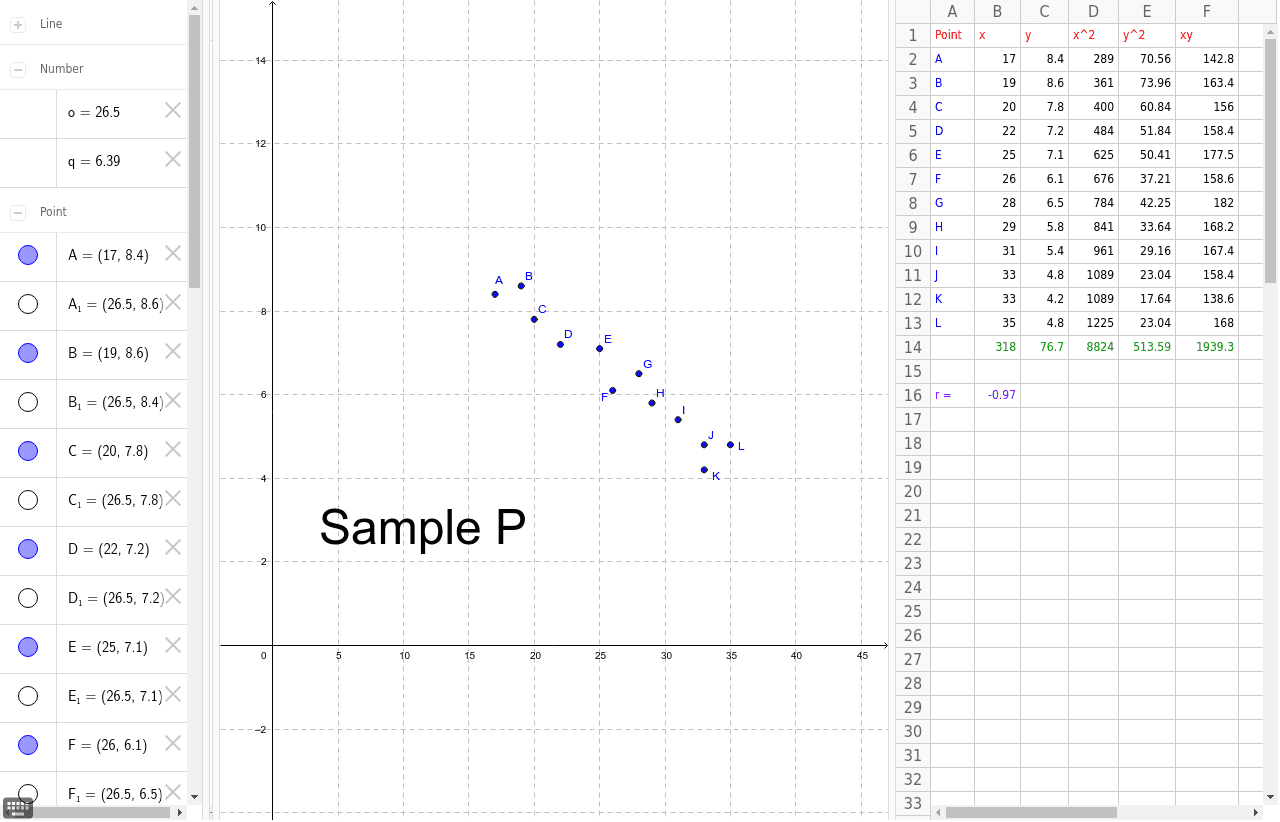
This example demonstrates the correlation between two variables. Key mathematical concepts include correlation analysis. The construction uses commands like MeanY, MeanX, OrthogonalLine, etc. Suitable for high school math education and learning correlation analysis.
GeoGebra Commands & Parameters
MeanY({A, B, C, D, E, F, G, H, I, J, K, L}) → qMeanX({A, B, C, D, E, F, G, H, I, J, K, L}) → oOrthogonalLine(A, b) → cOrthogonalLine(B, b) → dOrthogonalLine(C, b) → eOrthogonalLine(D, b) → fOrthogonalLine(E, b) → gOrthogonalLine(F, b) → hOrthogonalLine(G, b) → iOrthogonalLine(G, b) → jOrthogonalLine(H, b) → kOrthogonalLine(I, b) → lOrthogonalLine(J, b) → mOrthogonalLine(K, b) → nOrthogonalLine(L, b) → pIntersect(b, c) → MIntersect(b, d) → NIntersect(b, e) → OIntersect(b, f) → PIntersect(b, g) → QIntersect(b, h) → RIntersect(a, b) → SIntersect(b, i) → TIntersect(b, k) → UIntersect(b, l) → VIntersect(b, m) → WIntersect(b, p) → ZSegment(A, M) → A_ySegment(B, N) → B_ySegment(C, O) → C_ySegment(D, P) → D_ySegment(E, Q) → E_ySegment(F, R) → F_ySegment(T, G) → G_ySegment(U, H) → H_ySegment(V, I) → I_ySegment(W, J) → J_ySegment(Z, L) → L_yOrthogonalLine(A, a) → i_1OrthogonalLine(A, a) → j_1OrthogonalLine(B, a) → k_1OrthogonalLine(C, a) → l_1OrthogonalLine(D, a) → m_1OrthogonalLine(E, a) → n_1OrthogonalLine(F, a) → p_1OrthogonalLine(G, a) → q_1OrthogonalLine(H, a) → r_1OrthogonalLine(I, a) → s_1OrthogonalLine(J, a) → t_1OrthogonalLine(L, a) → a_2OrthogonalLine(K, a) → b_2Intersect(a, k_1) → A_1Intersect(a, i_1) → B_1Intersect(a, l_1) → C_1Intersect(a, m_1) → D_1Intersect(a, n_1) → E_1Intersect(a, q_1) → F_1Intersect(a, p_1) → G_1Intersect(a, r_1) → H_1Intersect(a, s_1) → I_1Intersect(a, t_1) → J_1Intersect(a, b_2) → K_1Segment(B, A_1) → B_xSegment(A, B_1) → A_xSegment(C, C_1) → C_xSegment(D, D_1) → D_xSegment(E, E_1) → E_xSegment(G, F_1) → G_xSegment(F, G_1) → F_xSegment(H, H_1) → H_xSegment(I_1, I) → I_xSegment(J_1, J) → J_xSegment(K_1, K) → K_xIntersect(a, b) → MeanOrthogonalLine(K, b) → rOrthogonalLine(L, a) → sIntersect(a, s) → L_1Intersect(b, r) → M_1Segment(L, L_1) → tSegment(K, M_1) → f_1Sum(B2:B13) → B14Sum(C2:C13) → C14Sum(D2:D13) → D14Sum(E2:E13) → E14Sum(F2:F13) → F14
AI Drawing Prompt Reference
Draw a coordinate system with 10 points, calculate their x and y coordinate averages, and draw vertical lines through these averages. Then, draw perpendicular lines from each point to the x-axis and find their intersections with the x-axis. Finally, connect each point to its corresponding intersection to show the correlation between variables.
The prompt above was compiled from the original drawing commands and is for reference only.