
Rotation of a function about x-axis (volume of revolution) by Edward Wicks
Loading the math board and drawing, please wait…
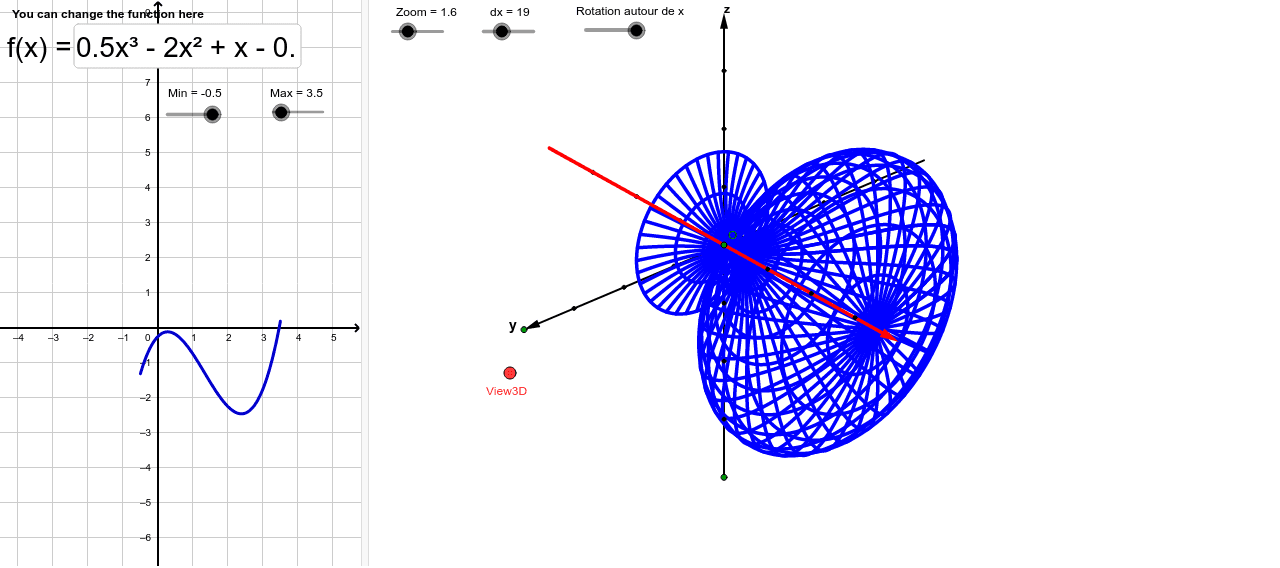
This example demonstrates the process of rotating a function's graph around the x-axis to generate a solid of revolution. It involves core mathematical concepts such as function graphs, rotation, volume calculation, and integral applications in calculus. Key GeoGebra commands/objects used include Vector, OrthogonalLine, Translate, Mirror, Segment, Point, Line, Sequence, Intersect, Function, and Textfield. Suitable for high school and above students studying calculus, solid geometry, and function transformations.
GeoGebra Commands & Parameters
Vector(B_1, X) → u_1Vector(B_1, Z) → wOrthogonalLine(View3D, yAxis) → aOrthogonalLine(View3D, xAxis) → bVector(B_1, Y) → vTranslate(O, Vector[u * u_1]) → O'_1Translate(O, Vector[u * v]) → O'_2Vector(O, O'_2) → zVector(O, O'_1) → dTranslate(O, Vector[u * w]) → O'_3Vector(O, O'_3) → eMirror(O'_1, O) → GMirror(O, O'_2) → O'_4Translate(O, Vector[-u * w]) → O'_5Translate(O, Vector[-u * v]) → O'Segment(O, O'_5) → iSegment(O, O') → jPoint(xAxis) → HLine(H, yAxis) → lPoint(xAxis) → ISequence(O + i * v, i, -3, 3) → liste5Sequence(O + i * w, i, -3, 3) → liste6Sequence(O + i * u_1, i, -3, 3) → liste7Intersect(xAxis, yAxis) → JPoint(yAxis) → KPoint(yAxis) → LVector(K, L) → qPoint(xAxis) → MVector(I, M) → rSequence((x(J) + i, y(J)), i, -3, 3) → liste8Sequence((x(J), y(J) + i), i, -3, 3) → liste9Function(f, Min, Max) → pMirror(O'_1, O) → NSegment(N, O) → n_1Sequence(CurveCartesian[x(O + t * u_1 + f(t) * cos(s) * v - f(t) * sin(s) * w), y(O + t * u_1 + f(t) * cos(s) * v - f(t) * sin(s) * w), t, Min, Max], s, 0, 2 * 3.141592653589793 * Rot / 24, 3.141592653589793 / dx) → liste10Sequence(CurveCartesian[x(O + t * u_1 + f(t) * cos(s) * v - f(t) * sin(s) * w), y(O + t * u_1 + f(t) * cos(s) * v - f(t) * sin(s) * w), s, 0, 2 * 3.141592653589793 * m / 24], t, Min, Max, (Max - Min) / dx) → liste11Textfield(f) → ChampTexte1
AI Drawing Prompt Reference
Draw a 3D solid formed by rotating a function graph around the x-axis, showing the rotation process and volume calculation. Include the x-axis, y-axis, and origin. Use vectors to represent the rotation direction, generate the outline of the solid by translating and mirroring points, and connect these outlines with curves to form the surface of the solid. Finally, label the function expression to present the 3D shape and mathematical principles of the solid.
The prompt above was compiled from the original drawing commands and is for reference only.