
Roots of Complex Numbers Visualization
Loading the math board and drawing, please wait…
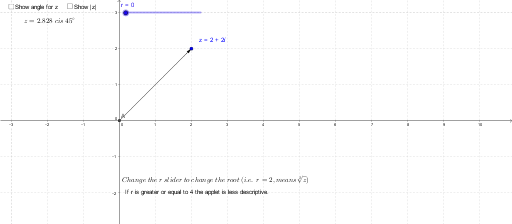
This example demonstrates how to visualize the roots of complex numbers in the complex plane. It involves core mathematical concepts such as complex numbers, roots, derivatives, logarithmic functions, planes, special points, and functions. The construction utilizes GeoGebra commands like Angle, Length, Intersect, Vector, Point, Distance, and Midpoint. Suitable for high school and above mathematics education to understand complex operations and geometric representations.
GeoGebra Commands & Parameters
Angle(z) → αLength(z) → aIntersect(xAxis, yAxis) → AVector(A, z) → uVector(A, z_0) → vVector(A, z_1) → wVector(A, z_2) → bVector(A, z_3) → cVector(A, z_4) → dVector(A, z_5) → eVector(A, z_6) → fVector(A, z_7) → gVector(A, z_8) → hPoint(xAxis) → BAngle(B, A, z) → βAngle(B, A, z_0) → γAngle(B, A, z_1) → δAngle(B, A, z_1) → εDistance(A, z_0) → distanceAz0Midpoint(A, z_0) →Distance(A, z_1) → distanceAz1Midpoint(A, z_1) →Angle(B, A, z_0) → ζAngle(B, A, z_1) → ηAngle(B, A, z_2) → θDistance(A, z_2) → distanceAz2Midpoint(A, z_2) →Distance(A, z) → distanceAzMidpoint(A, z) →