
Roller Coaster Polynomial
Loading the math board and drawing, please wait…
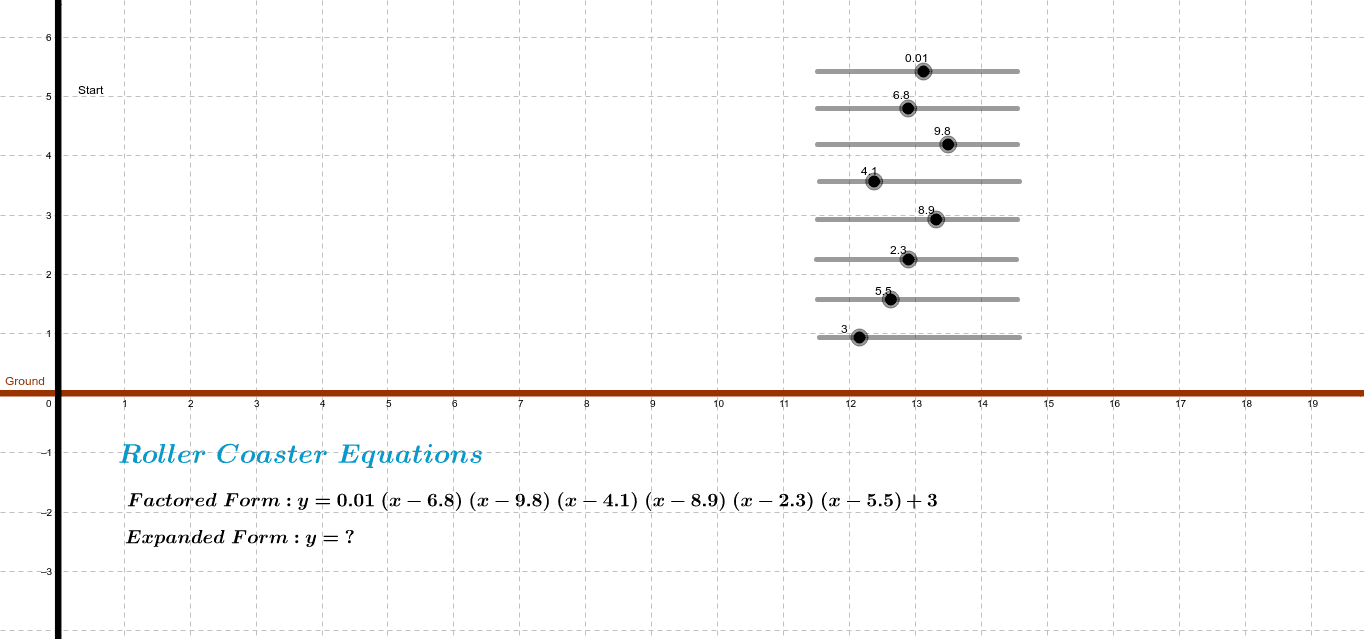
This example dynamically demonstrates the graph of polynomial functions, involving core concepts like function graphs, derivatives, slopes, and geometric constructions. Key GeoGebra commands used include objects c, d, f, g, h, j, l, a, p, q, Ground, Start, text2, text3, text1 for plotting curves, ground, start point, and annotations. Suitable for high school mathematics education to understand function properties and geometric construction techniques.
GeoGebra Commands & Parameters
Numeric c(6.8)Numeric d(9.8)Numeric f(4.1)Numeric g(8.9)Numeric h(2.3)Numeric j(5.5)Numeric l(3.0)Numeric a(0.006)p(x) = ((((((a * (x - c)) * (x - d)) * (x - f)) * (x - g)) * (x - h)) * (x - j)) + lFunction qLine Ground(0.0, 1.0, 0.0)Line Start(1.0, 0.0, 0.0)
AI Drawing Prompt Reference
Draw a dynamic graph of a polynomial function, showing the function curve, its derivative, slopes, and geometric constructions. Include a ground reference line and a start reference point, with annotations for key points and function properties. Use a slider to adjust parameters, dynamically demonstrating function changes and geometric relationships.
The prompt above was compiled from the original drawing commands and is for reference only.