
Riemann Sums - Rectangular Approximation (LRAM, RRAM, MRAM) by matte Lena
Loading the math board and drawing, please wait…
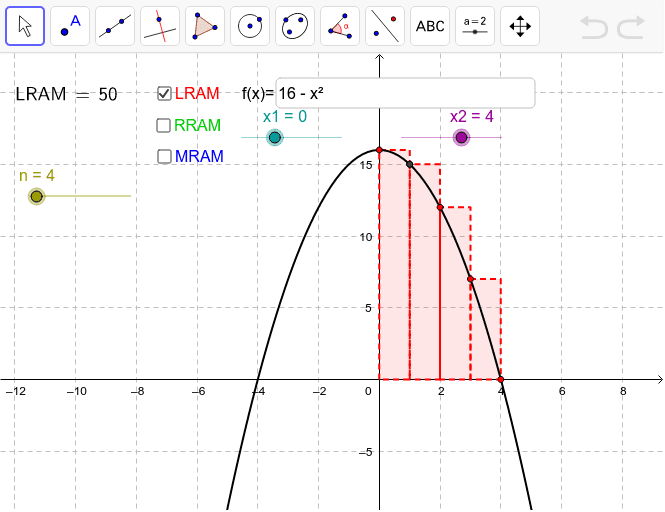
This example demonstrates how to approximate the definite integral of a function using the Left Riemann Sum (LRAM), Right Riemann Sum (RRAM), and Midpoint Riemann Sum (MRAM). Key mathematical concepts include definite integrals and Riemann sums. By adjusting the number of rectangles and the upper and lower bounds, the geometric meaning of integration can be intuitively understood. GeoGebra commands used include Sequence, Sum, LaTeX, Textfield, and Element, suitable for high school mathematics education and learning.
GeoGebra Commands & Parameters
Sequence(f(i) * h, i, x1 + h / 2, x2 - h / 2, h) → M2Sequence(f(i) * h, i, x1 + h, x2, h) → R2Sequence(f(i) * h, i, x1, x2 - h, h) → L2Sequence((i, f(i)), i, x1, x2, h) → L1Sequence(Polygon[(x(Element[L1, i]), 0), Element[L1, i], (x(Element[L1, i + 1]), y(Element[L1, i])), (x(Element[L1, i + 1]), 0)], i, 1, n) → LeftPSequence(Polygon[(x(Element[L1, i]), 0), (x(Element[L1, i]), y(Element[L1, i + 1])), Element[L1, i + 1], (x(Element[L1, i + 1]), 0)], i, 1, n) → RightPSequence((i + h / 2, f(i + h / 2)), i, x1, x2 - h, h) → LMSequence(Polygon[(x(Element[L1, i]), 0), (x(Element[L1, i]), y(Element[LM, i])), (x(Element[L1, i + 1]), y(Element[LM, i])), (x(Element[L1, i + 1]), 0)], i, 1, n) → MidPSum(L2) → LRAMSum(R2) → RRAMSum(M2) → MRAMLaTeX(LRAM, true, true) → text4LaTeX(RRAM, true, true) → text5LaTeX(MRAM, true, true) → text6Textfield(f) → inputBox1Element(L1, 2) → A
AI Drawing Prompt Reference
Draw a function graph and demonstrate the geometric meaning of its left Riemann sum, right Riemann sum, and midpoint Riemann sum. First, plot the function curve, then draw the rectangles for the left Riemann sum, right Riemann sum, and midpoint Riemann sum based on the given interval and number of rectangles, with each rectangle's height corresponding to the function value. Finally, calculate and display the numerical values of each Riemann sum to intuitively understand the concept of integration.
The prompt above was compiled from the original drawing commands and is for reference only.