
Rhodonea Curve Variations: Parametric Petal Patterns with Geometric Transformati
Loading the math board and drawing, please wait…
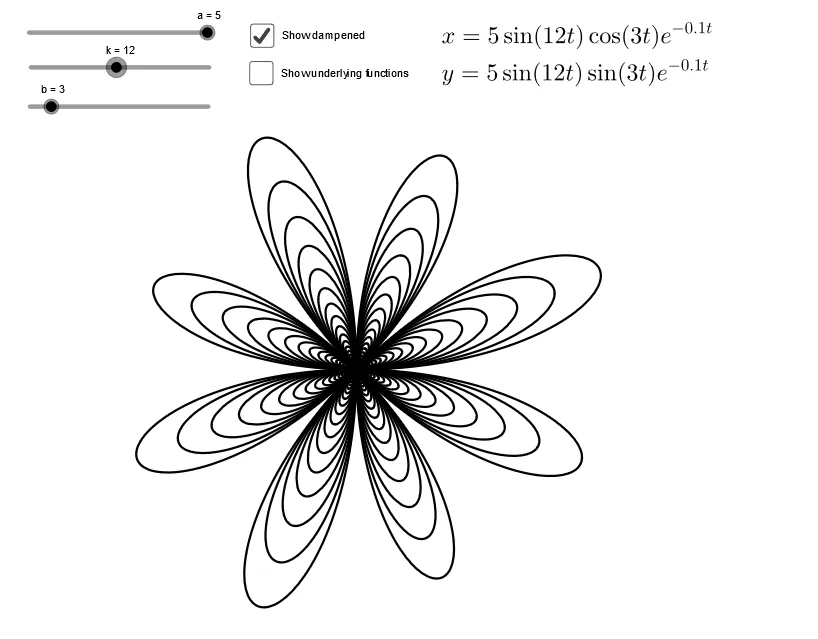
This GeoGebra example demonstrates variations of the Rhodonea (rose) curve, generating multi-petal floral patterns by adjusting parameters, and optionally applying geometric transformations to create composite or 3D-like structures. Core mathematical concepts include parametric equations, periodic trigonometric functions (sine/cosine), conversion between polar and Cartesian coordinates, and geometric transformations such as rotation, scaling, and translation. The construction uses the CurveCartesian command with objects like b, k, a, g, f, c, h, p, d, e, where parameters k and a likely control the number of petals and amplitude, with sliders for dynamic adjustment and text objects (text1) displaying values. Suitable for high school to undergraduate mathematics education, this example helps visualize parametric curves, trigonometric graphs, and transformation effects, and can also inspire artistic pattern design.
GeoGebra Commands & Parameters
CurveCartesian(f(t), g(t), t, 0, (32 * π)) → cCurveCartesian(h(t), p(t), t, 0, (32 * π)) → d
AI Drawing Prompt Reference
Draw two rose curves defined by parametric equations, each producing multi-petal floral patterns. The first curve uses a sine-based function, while the second uses a cosine-based function, both traced from zero to thirty-two times pi, creating dense, layered spiral petals. Overlay the two curves in the same coordinate system, with adjustable parameters controlling petal count and amplitude to dynamically change density and size. The overall shape is symmetric and periodic, illustrating trigonometric functions and polar-to-Cartesian conversion, suitable for artistic pattern design.
The prompt above was compiled from the original drawing commands and is for reference only.