
Resistance of Mean and Median
Loading the math board and drawing, please wait…
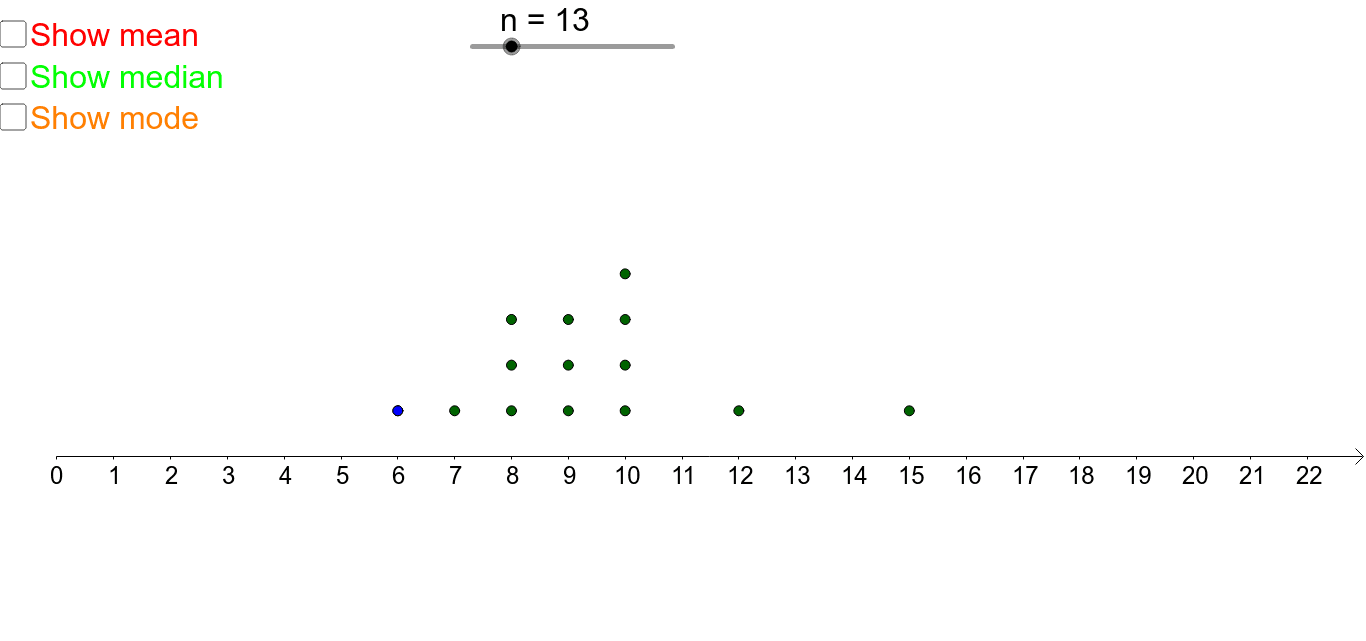
This interactive GeoGebra model illustrates the resistance of the mean and median to outliers. Key mathematical concepts include arithmetic mean, median, frequency distribution, and statistical robustness. The construction employs GeoGebra commands like Sequence, DotPlot, Mean, and Median to dynamically generate data points and compute statistics. It is designed for middle school statistics classes or introductory data analysis, providing a visual understanding of how different measures of central tendency respond to data distribution changes.
GeoGebra Commands & Parameters
Ray((0, 1), (1, 1)) → aSequence(round(RandomNormal[10, 2]), i, 1, n) → list1Point(a) → AFrequency(list1) → countsUnique(list1) → numbersDotPlot(Append[x(A), list1]) → dotsMean(Append[x(A), list1]) → meanMedian(Append[x(A), list1]) → medElement(Mode[Append[x(A), list1]], 1) → modePoint({mean, -1}) → meanAPoint({mean, -1}) → meanBPoint({med, -1}) → medAPoint({med, -1}) → medBPoint({mode, -1}) → modeAPoint({mode, -1}) → modeBVector(modeA, modeB) → uVector(medA, medB) → vVector(meanA, meanB) → w