
Representing Ratios with Tables by GeoGebra Classroom Activities
Loading the math board and drawing, please wait…
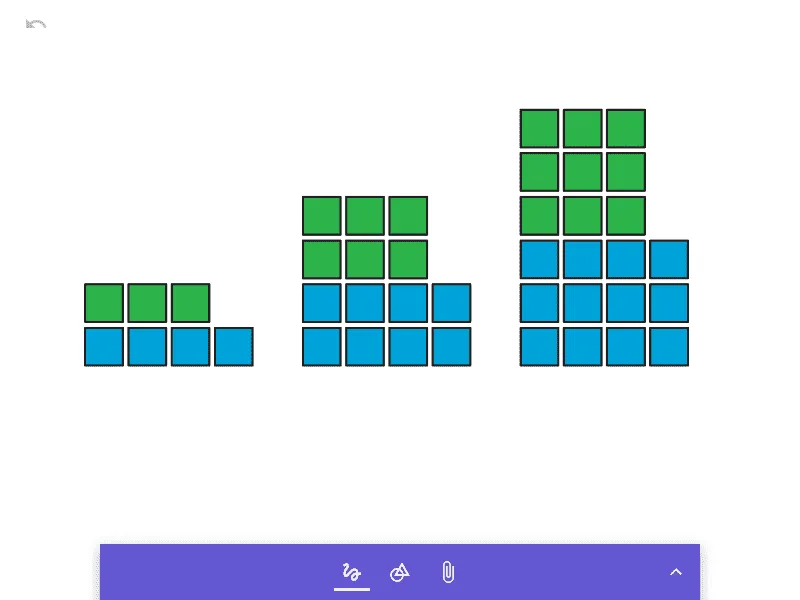
This example demonstrates how to represent ratio relationships using tables. It involves the core mathematical concept of ratios. By constructing tables, students can intuitively understand the changes in ratio relationships. This example uses GeoGebra's table object. Suitable for middle school and above students to learn about ratio relationships.
AI Drawing Prompt Reference
Create a table to illustrate ratio relationships, visually representing how two quantities change in proportion, suitable for middle school students to understand ratio concepts, the table should include multiple sets of data, with line segments or shapes indicating these data points and their proportional relationships, start by drawing the table framework, then fill in the data points and connect them with line segments, finally differentiate different ratio groups with colors or styles.
The prompt above was compiled from the original drawing commands and is for reference only.