
Relationship Among Fractions, Decimals, and Percentages
Loading the math board and drawing, please wait…
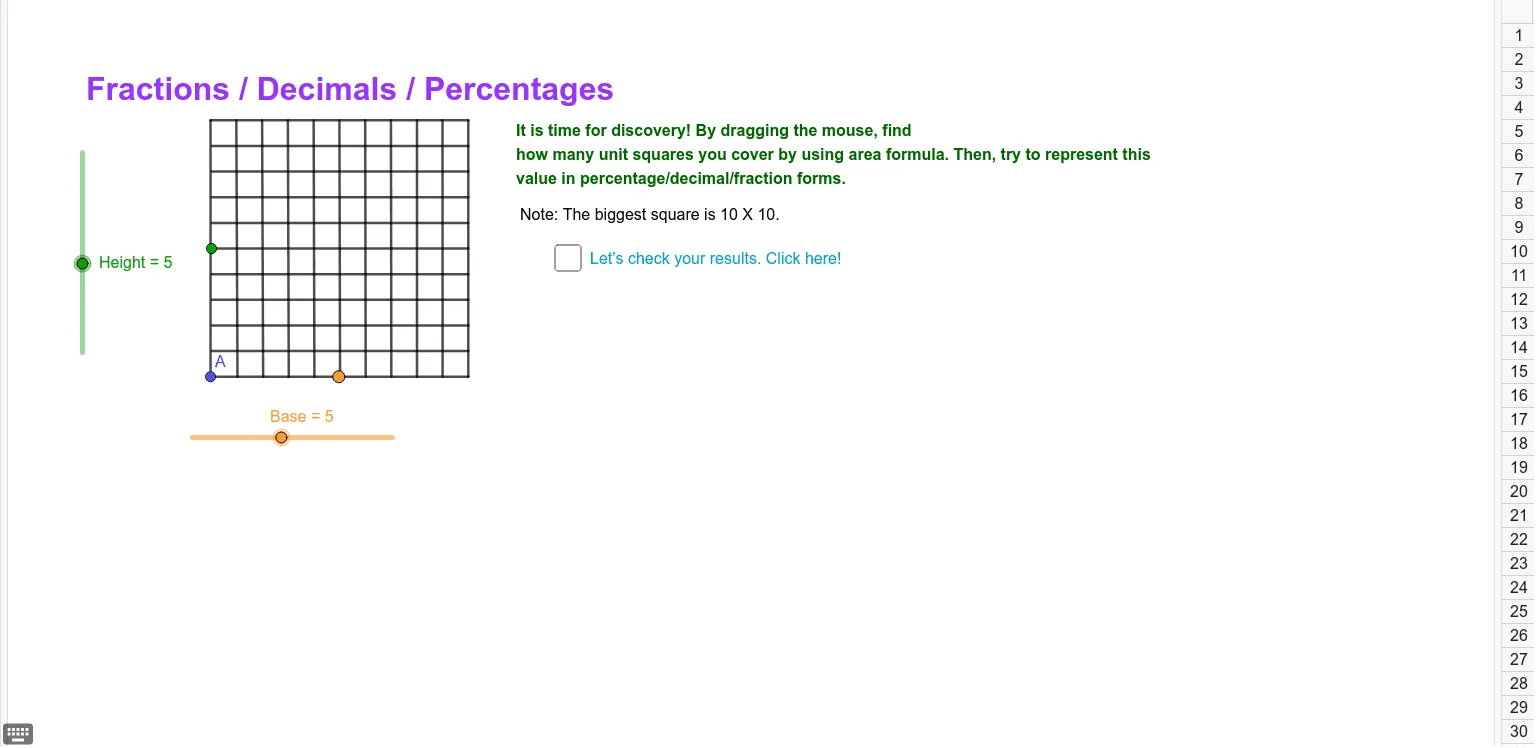
This example demonstrates the relationship between fractions, decimals, and percentages. Key mathematical concepts include the conversion between these forms. Using GeoGebra commands such as Segment, Point, and Intersect, the example dynamically illustrates these conversions. Suitable for high-grade elementary to junior high school students.
GeoGebra Commands & Parameters
Segment(A_1, O) → jSegment(G_1, U) → qPoint(q) → L_1Segment(L_1, F) → dPoint(Circle[A, Base]) → Base_1Point(Circle[A, Height]) → Height_1Point(q) → H_1Segment(L, V) → gSegment(H_1, B) → tSegment(A, K) → fSegment(W, M) → hSegment(N, Z) → iSegment(P, B_1) → kSegment(C_1, Q) → lSegment(R, D_1) → mSegment(E_1, S) → nSegment(T, F_1) → pSegment(U, A) → rSegment(K, G_1) → sPoint(q) → I_1Segment(C, I_1) → aPoint(q) → J_1Segment(J_1, D) → bPoint(q) → K_1Segment(E, K_1) → cPoint(q) → M_1Segment(G, M_1) → ePoint(q) → N_1Segment(N_1, H) → f_1Segment(I, O_1) → g_1Point(q) → P_1Segment(P_1, J) → h_1Intersect(q, r) → Q_1Intersect(f, s) → S_1
AI Drawing Prompt Reference
Draw a diagram illustrating the relationship between fractions, decimals, and percentages. Start by drawing a line segment AB, then place points C, D, E, and F on AB to represent different fraction, decimal, and percentage values. Next, draw a parallel line segment GH to represent another form of value conversion. Finally, use intersection points Q and S to show the conversion relationship between fractions and decimals.
The prompt above was compiled from the original drawing commands and is for reference only.