
Regression Analysis Demo
Loading the math board and drawing, please wait…
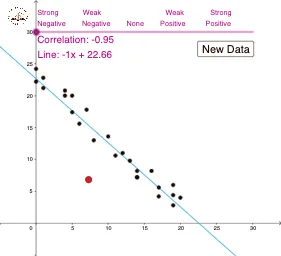
This example demonstrates data regression analysis by plotting a scatter graph and fitting a best-fit curve, involving core math concepts like Pearson's PMCC, linear regression equations, parametric curves, random variables, and percentage calculations. Key GeoGebra commands and objects used include Random, If, PMCC, and FitPoly as outlined in the construction summary. Suitable for high school and above learners to understand the application of regression analysis in statistics and calculus.
GeoGebra Commands & Parameters
Random(0, 20) → b_1, 12If(scatter ≟ 0, 10.5, 1 / ((5 * scatter))) → deviationIf(scatter > 0, Random[0, 3], scatter < 0, Random[22, 25], scatter ≟ 0, Random[5, 15]) → interceptRandom(0, 20) → a, 10Random(0, 20) → a_1, 17Random(0, 20) → w, 6Random(0, 20) → v, 1Random(0, 20) → u, 4Random(0, 20) → t, 16Random(0, 20) → s, 19Random(0, 20) → r, 14Random(0, 20) → q, 0Random(0, 20) → p, 5Random(0, 20) → o, 4Random(0, 20) → n, 0Random(0, 20) → m, 19Random(0, 20) → l, 17Random(0, 20) → k, 11Random(0, 20) → j, 13Random(0, 20) → i, 5Random(0, 20) → h, 20Random(0, 20) → g, 8Random(0, 20) → f, 19Random(0, 20) → e, 14Random(0, 20) → d, 14Random(0, 20) → c, 1Random(0, 20) → b, 7PMCC(list) → correlationFitPoly(list, 1) → g_1