
Rectangular Coordinates and Triangle Classification Interactive Demo
Loading the math board and drawing, please wait…
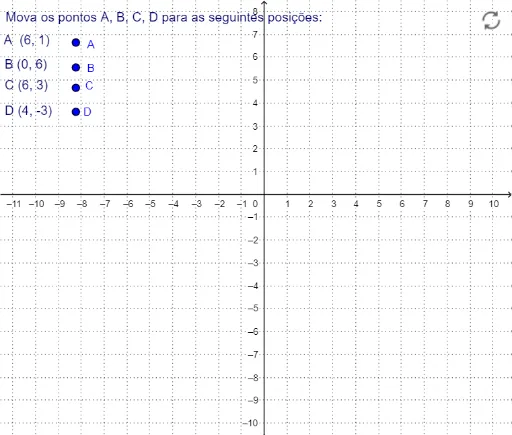
This GeoGebra example demonstrates a geometric construction within a rectangular coordinate system, featuring multiple points (A, B, C, D and their primed counterparts) and text labels (such as txtGoodA, Agood) used to mark and verify different triangle types. The core mathematical concepts involve coordinate geometry, isosceles triangles, scalene triangles, and similarity transformations, while also incorporating elements like cones and LCM/GCD, though the primary focus is on points and triangle classification in the coordinate plane. The construction uses GeoGebra point objects, text objects, and the coordinate system, creating primed points (A', B', C', D') to form symmetric or transformed relationships, with dynamic text labels indicating classification results. This example is suitable for middle and high school students learning analytic geometry and triangle properties, serving as a classroom demonstration or self-exploration tool to understand coordinate representation, triangle classification, and the application of similarity transformations in geometry.
GeoGebra Commands & Parameters
Point A(-8.233795183464503, 6.645226079934625)(Random[ceil(x(Corner[1])), floor(x(Corner[2]))], Random[ceil(y(Corner[1])), floor(y(Corner[4]))])(Random[ceil(x(Corner[1])), floor(x(Corner[2]))], Random[ceil(y(Corner[1])), floor(y(Corner[4]))])(Random[ceil(x(Corner[1])), floor(x(Corner[2]))], Random[ceil(y(Corner[1])), floor(y(Corner[4]))])(Random[ceil(x(Corner[1])), floor(x(Corner[2]))], Random[ceil(y(Corner[1])), floor(y(Corner[4]))])Point B(-8.233795183464503, 5.553024193937998)Point C(-8.233795183464503, 4.663081916459264)Point D(-8.233795183464503, 3.611331952166216)Distance[A, A'] < 0.1Distance[B, B'] < 0.1Distance[C, C'] < 0.1Distance[D, D'] < 0.1
AI Drawing Prompt Reference
Draw a geometric construction in a rectangular coordinate system featuring multiple points and their corresponding points, with text labels indicating different triangle types. Start by plotting a point, then generate four random points. Next, create four new points that form symmetric or transformed relationships with the initial points. Measure the distances between each point and its corresponding point to ensure they are very close. Finally, use text labels to display the classification of the triangles, such as isosceles, scalene, and similar triangles.
The prompt above was compiled from the original drawing commands and is for reference only.