
Rectangle Areas and Point Position
Loading the math board and drawing, please wait…
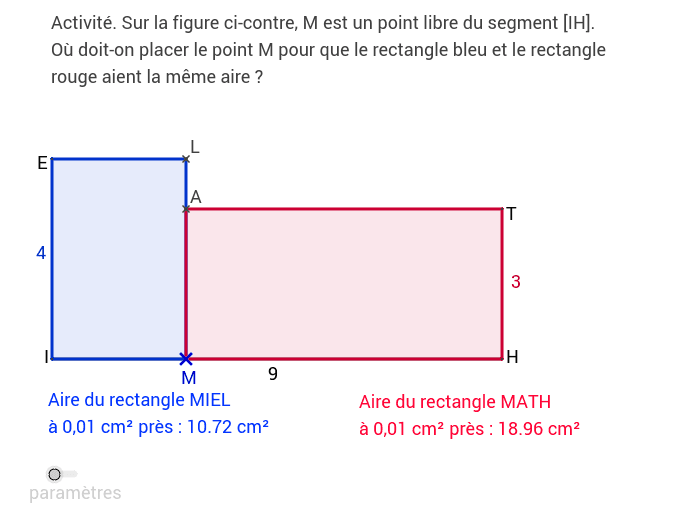
This example demonstrates the dynamic relationship between rectangle area changes and internal point positioning by adjusting parameters. Key math concepts include rectangle area calculation, coordinate geometry, and geometric transformations. GeoGebra commands used in construction are Intersect, Circle, OrthogonalLine, Segment, Point, and Polygon. Suitable for high school mathematics education to understand the connection between parametric geometry and function graphs.
GeoGebra Commands & Parameters
Intersect(xAxis, yAxis) → ICircle(I, a) → c_1OrthogonalLine(I, yAxis) → b_1Intersect(c_1, b_1, 1) → HOrthogonalLine(I, b_1) → dOrthogonalLine(H, b_1) → eCircle(I, b) → fCircle(H, c) → gIntersect(f, d, 1) → EIntersect(g, e, 1) → TOrthogonalLine(E, d) → iOrthogonalLine(T, e) → jSegment(I, H) → kSegment(I, H) → lPoint(l) → MOrthogonalLine(M, l) → hOrthogonalLine(E, h) → mOrthogonalLine(T, h) → nIntersect(h, n) → AIntersect(h, m) → LPolygon(I, E, L, M) → poly1, i_1, e_1, l_1, m_1Polygon(M, A, T, H) → poly2, m_2, a_1, t, h_1
AI Drawing Prompt Reference
Draw a dynamic rectangle to demonstrate the relationship between area changes and internal point positioning by adjusting parameters. Start by plotting the intersection of coordinate axes, then draw two circles centered at this point with different radii. Construct orthogonal lines from the intersections of these circles with the axes to determine the rectangle's vertices. Next, draw two circles inside the rectangle and find their intersections with the orthogonal lines to get two points. Finally, connect these points to form two polygons, showing how the internal points move dynamically as the rectangle's area changes.
The prompt above was compiled from the original drawing commands and is for reference only.